The Waller-Duncan k-ratio t test is performed on all main effect means in the MEANS statement. See the K-RATIO option for information on controlling details of the test.
waller.test(
  y,
  trt,
  DFerror,
  MSerror,
  Fc,
  K = 100,
  group = TRUE,
  main = NULL,
  console = FALSE
)
Arguments
| y | model(aov or lm) or answer of the experimental unit |
|---|---|
| trt | Constant( only y=model) or vector treatment applied to each unit |
| DFerror | Degrees of freedom |
| MSerror | Mean Square Error |
| Fc | F Value |
| K | K-RATIO |
| group | TRUE or FALSE |
| main | Title |
| console | logical, print output |
Value
Statistics of the model
Design parameters
Statistical summary of the study variable
Comparison between treatments
Formation of treatment groups
Details
It is necessary first makes a analysis of variance.
K-RATIO (K): value specifies the Type 1/Type 2 error seriousness ratio for
the Waller-Duncan test. Reasonable values for KRATIO are 50, 100, and 500,
which roughly correspond for the two-level case to ALPHA levels of 0.1,
0.05, and 0.01. By default, the procedure uses the default value of 100.
if y = model, then to apply the instruction:
waller.test (model, "trt",
alpha = 0.05, group = TRUE, main = NULL, console = FALSE)
where the model
class is aov or lm.
References
Waller, R. A. and Duncan, D. B. (1969). A Bayes Rule for the
Symmetric Multiple Comparison Problem, Journal of the American Statistical
Association 64, pages 1484-1504.
Waller, R. A. and Kemp, K. E. (1976) Computations of Bayesian t-Values for
Multiple Comparisons, Journal of Statistical Computation and Simulation, 75,
pages 169-172.
Steel & Torry & Dickey. Third Edition 1997 Principles and procedures of statistics a biometrical approach
See also
BIB.test, DAU.test,
duncan.test, durbin.test,
friedman, HSD.test, kruskal,
LSD.test, Median.test, PBIB.test,
REGW.test, scheffe.test, SNK.test,
waerden.test, plot.group
Examples
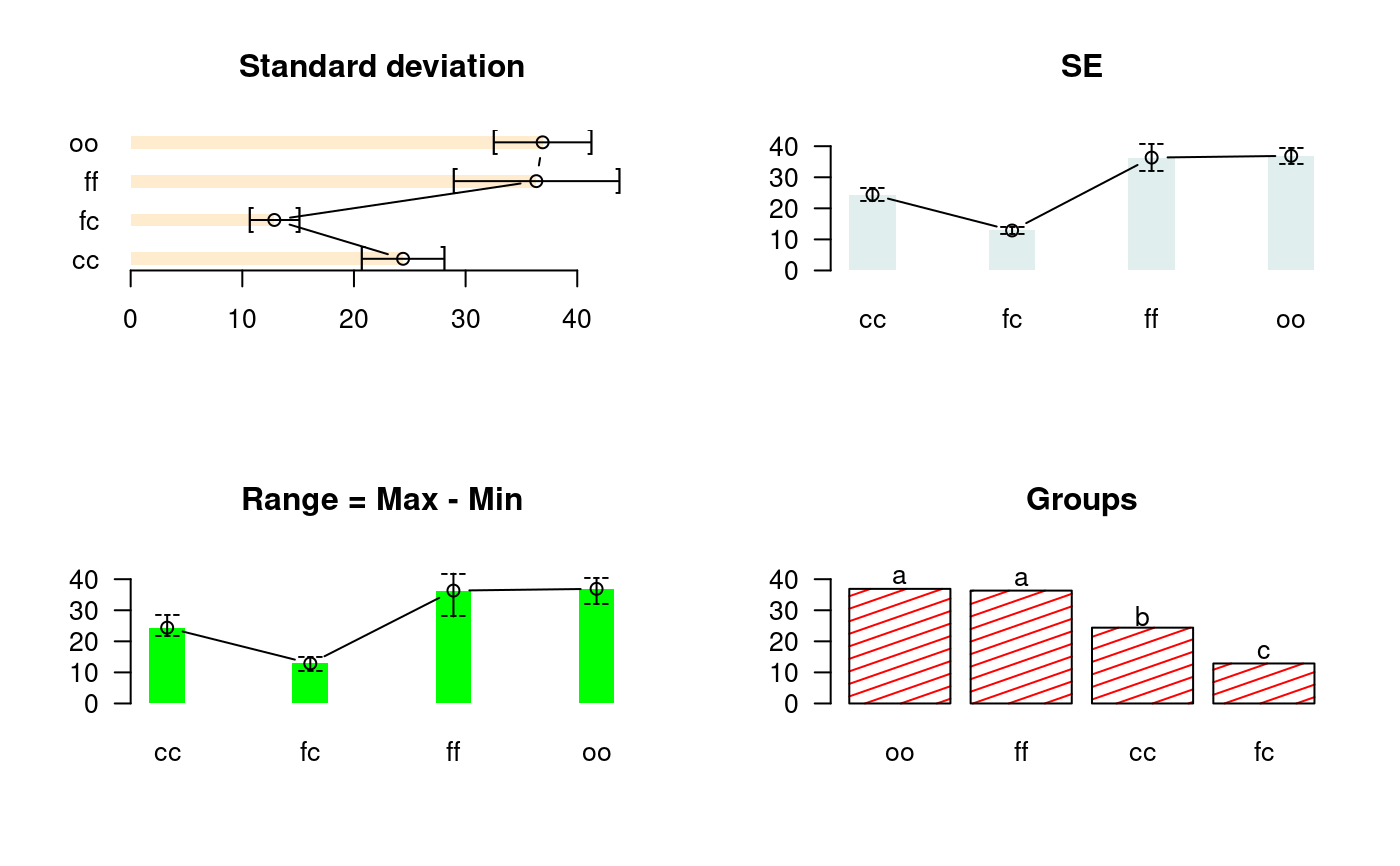
library(agricolae)
data(sweetpotato)
model<-aov(yield~virus, data=sweetpotato)
out <- waller.test(model,"virus", group=TRUE)
#startgraph
oldpar<-par(mfrow=c(2,2))
# variation: SE is error standard
# variation: range is Max - Min
bar.err(out$means,variation="SD",horiz=TRUE,xlim=c(0,45),bar=FALSE,
col=colors()[25],space=2, main="Standard deviation",las=1)
bar.err(out$means,variation="SE",horiz=FALSE,ylim=c(0,45),bar=FALSE,
col=colors()[15],space=2,main="SE",las=1)
bar.err(out$means,variation="range",ylim=c(0,45),bar=FALSE,col="green",
space=3,main="Range = Max - Min",las=1)
bar.group(out$groups,horiz=FALSE,ylim=c(0,45),density=8,col="red",
main="Groups",las=1)#endgraph
# Old version HSD.test()
df<-df.residual(model)
MSerror<-deviance(model)/df
Fc<-anova(model)["virus",4]
out <- with(sweetpotato,waller.test(yield, virus, df, MSerror, Fc, group=TRUE))
print(out)#> $statistics
#>     Mean Df      CV  MSerror  F.Value Waller CriticalDifference
#>   27.625  8 17.1666 22.48917 17.34478  2.236           8.657906
#>
#> $parameters
#>            test name.t ntr   K
#>   Waller-Duncan  virus   4 100
#>
#> $means
#>       yield      std r  Min  Max   Q25  Q50   Q75
#> cc 24.40000 3.609709 3 21.7 28.5 22.35 23.0 25.75
#> fc 12.86667 2.159475 3 10.6 14.9 11.85 13.1 14.00
#> ff 36.33333 7.333030 3 28.0 41.8 33.60 39.2 40.50
#> oo 36.90000 4.300000 3 32.1 40.4 35.15 38.2 39.30
#>
#> $comparison
#> NULL
#>
#> $groups
#>       yield groups
#> oo 36.90000      a
#> ff 36.33333      a
#> cc 24.40000      b
#> fc 12.86667      c
#>
#> attr(,"class")
#> [1] "group"par(oldpar)