A nonparametric test for several independent samples. The median test is designed to examine whether several samples came from populations having the same median.
Median.test(
  y,
  trt,
  alpha = 0.05,
  correct = TRUE,
  simulate.p.value = FALSE,
  group = TRUE,
  main = NULL,
  console = TRUE
)
Arguments
| y | Variable response |
|---|---|
| trt | Treatments |
| alpha | error type I |
| correct | a logical indicating whether to apply continuity correction when computing the test statistic for 2 groups. The correction will not be bigger than the differences themselves. No correction is done if simulate.p.value = TRUE. |
| simulate.p.value | a logical indicating whether to compute p-values by Monte Carlo simulation |
| group | TRUE or FALSE |
| main | Title |
| console | logical, print output |
Value
Statistics of the model
Design parameters
Statistical summary of the study variable
Comparison between treatments
Formation of treatment groups
Details
The data consist of k samples of possibly unequal sample size.
Greater:
is the number of values that exceed the median of all data and
LessEqual: is the number less than or equal to the median of all data.
References
Practical Nonparametrics Statistics. W.J. Conover, 1999
See also
BIB.test, DAU.test,
duncan.test, durbin.test,
friedman, HSD.test, kruskal,
LSD.test, PBIB.test, REGW.test,
scheffe.test, SNK.test,
waerden.test, waller.test,
plot.group
Examples
library(agricolae)
# example 1
data(corn)
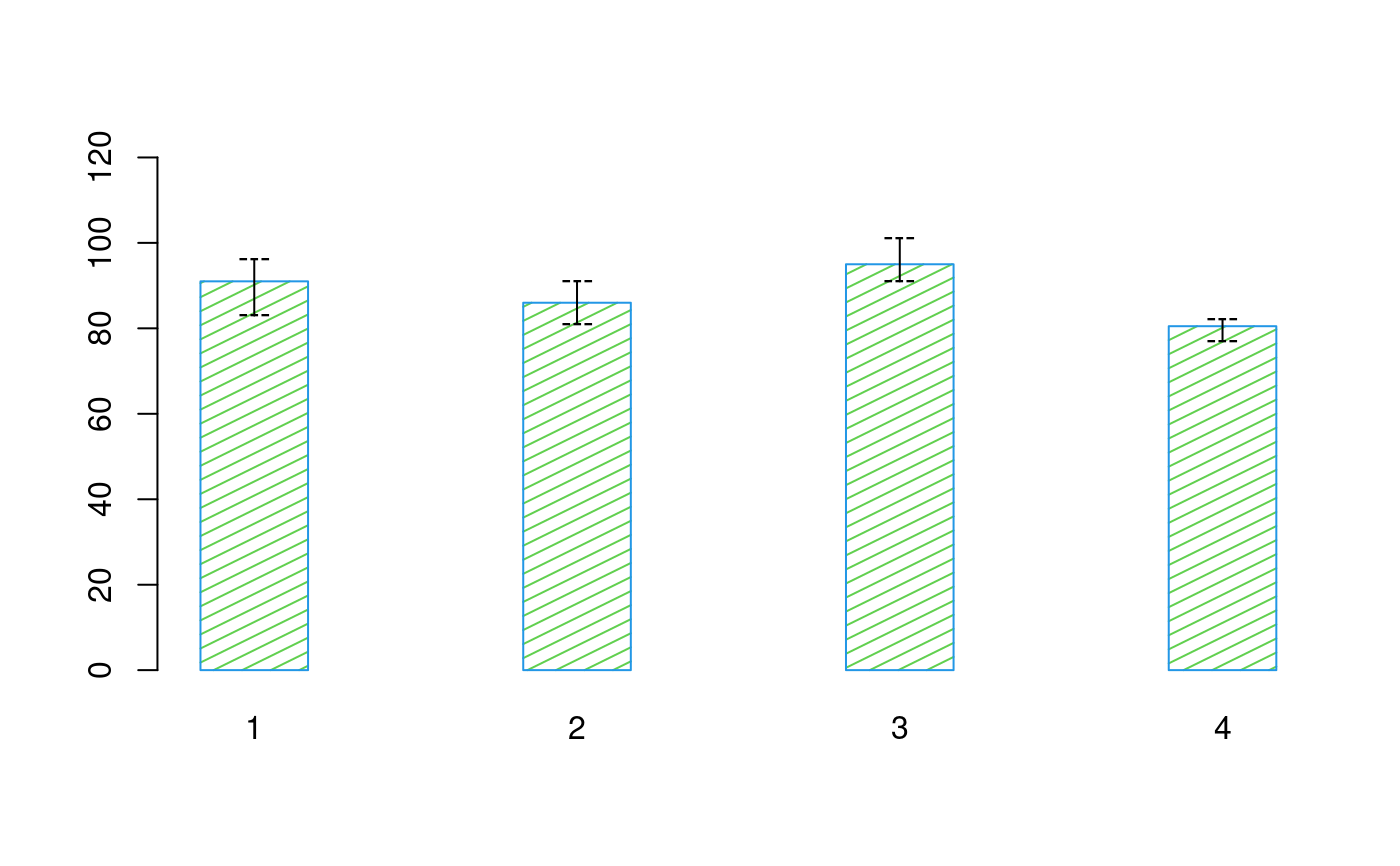
out<-with(corn,Median.test(observation,method,console=FALSE))
z<-bar.err(out$medians,variation = "range",ylim=c(0,120),
           space=2,border=4,col=3,density=10,angle=45)# example 2
out<-with(corn,Median.test(observation,method,console=FALSE,group=FALSE))
print(out$comparison)#>         median     chisq pvalue signif.
#> 1 and 2   89.0  2.554444 0.1100
#> 1 and 3   92.5  6.349206 0.0117       *
#> 1 and 4   83.0 13.432099 0.0002     ***
#> 2 and 3   91.0 13.246753 0.0003     ***
#> 2 and 4   82.5 14.400000 0.0001     ***
#> 3 and 4   82.0 15.000000 0.0001     ***
