Plotting the standard error or standard deviance of a multiple comparison of means
Source:R/bar.err.R
bar.err.RdIt plots bars of the averages of treatments and standard error or standard deviance. It uses the objects generated by a procedure of comparison like LSD, HSD, Kruskal and Waller-Duncan.
x: data frame formed by 5 columns: name of the bars, height, level out: LSD.test, HSD, waller.test, scheffe.test, duncan.test, SNK.test, friedman, kruskal, waerden.test and Median.test.
bar.err(
  x,
  variation = c("SE", "SD", "range", "IQR"),
  horiz = FALSE,
  bar = TRUE,
  ...
)

# S3 method for default
bar.err(
  x,
  variation = c("SE", "SD", "range", "IQR"),
  horiz = FALSE,
  bar = TRUE,
  ...
)
Arguments
| x | object means of the comparisons the LSD.test, HSD.test,...,etc |
|---|---|
| variation | SE=standard error, range=Max-Min or IQR=interquartil range |
| horiz | Horizontal or vertical bars |
| bar | paint bar |
| ... | Parameters of the function barplot() |
Value
A list with numeric vectors giving the coordinates of all the bar midpoints drawn.
x eje-1 coordinate
height eje-2 coordinate by group
See also
Examples
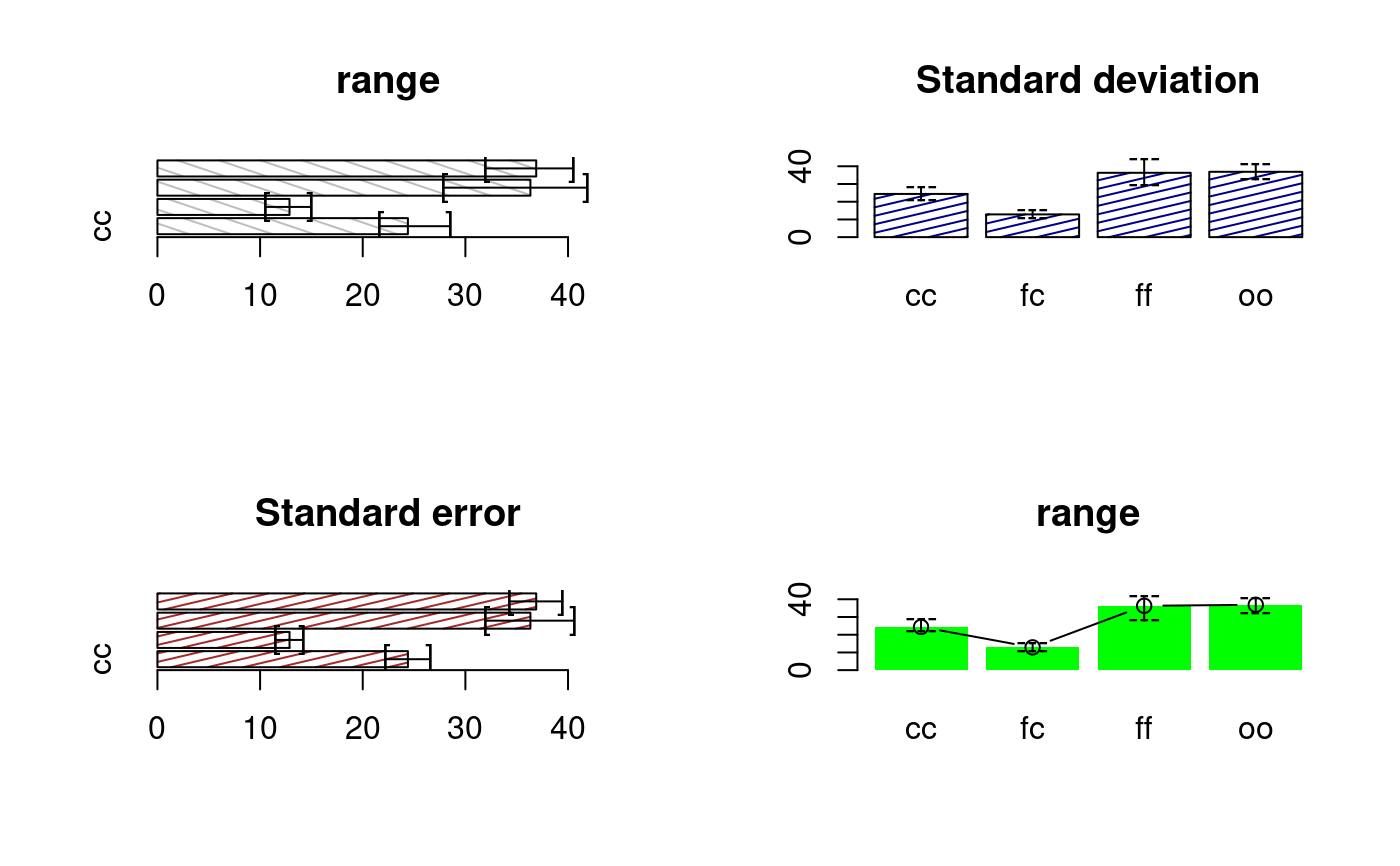
library(agricolae) data(sweetpotato) model<-aov(yield~virus,data=sweetpotato) out <- waller.test(model,"virus", console=TRUE, main="Yield of sweetpotato\ndealt with different virus")#> #> Study: Yield of sweetpotato #> dealt with different virus #> #> Waller-Duncan K-ratio t Test for yield #> #> This test minimizes the Bayes risk under additive loss and certain other assumptions #> ...... #> K ratio 100.00000 #> Error Degrees of Freedom 8.00000 #> Error Mean Square 22.48917 #> F value 17.34478 #> Critical Value of Waller 2.23600 #> #> virus, means #> #> yield std r Min Max #> cc 24.40000 3.609709 3 21.7 28.5 #> fc 12.86667 2.159475 3 10.6 14.9 #> ff 36.33333 7.333030 3 28.0 41.8 #> oo 36.90000 4.300000 3 32.1 40.4 #> #> Minimum Significant Difference 8.657906 #> Treatments with the same letter are not significantly different. #> #> yield groups #> oo 36.90000 a #> ff 36.33333 a #> cc 24.40000 b #> fc 12.86667 coldpar<-par(mfrow=c(2,2),cex=1) bar.err(out$means,variation="range",horiz=TRUE,xlim=c(0,45),angle=125,density=6, main="range") bar.err(out$means,variation="SD",ylim=c(0,45),col=colors()[30], main="Standard deviation",density=8) bar.err(out$means,variation="SE",horiz=TRUE,xlim=c(0,45),density=8, col="brown",main="Standard error") bar.err(out$means,variation="range",ylim=c(0,45),bar=FALSE,col="green", main="range")par(mfrow=c(1,2),cex=1) bar.err(out$means,variation="range",ylim=c(0,45),bar=FALSE,col=0) abline(h=0) # horiz = TRUE bar.err(out$means,variation="SE",horiz=TRUE,xlim=c(0,45),bar=FALSE,col=0)

