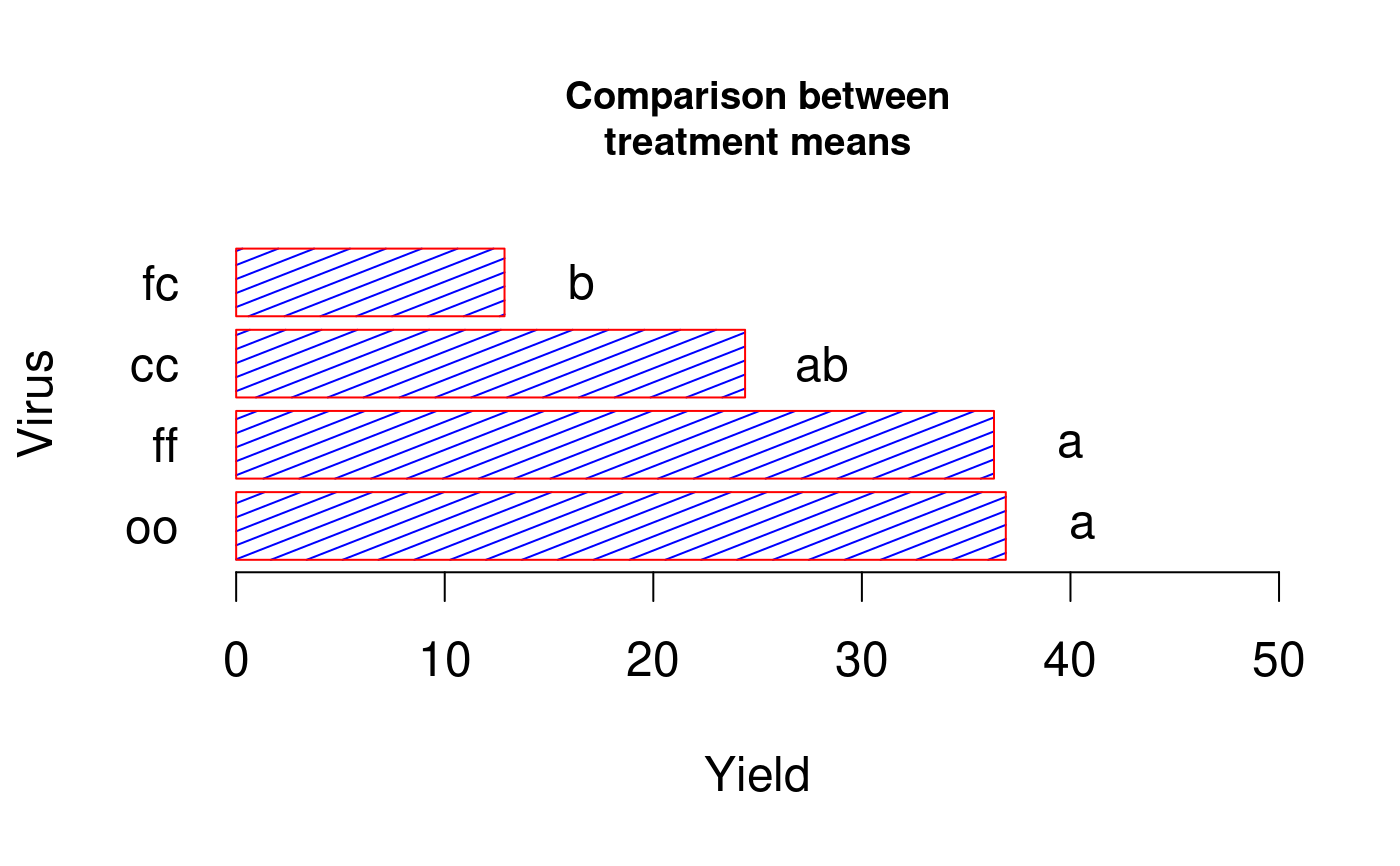
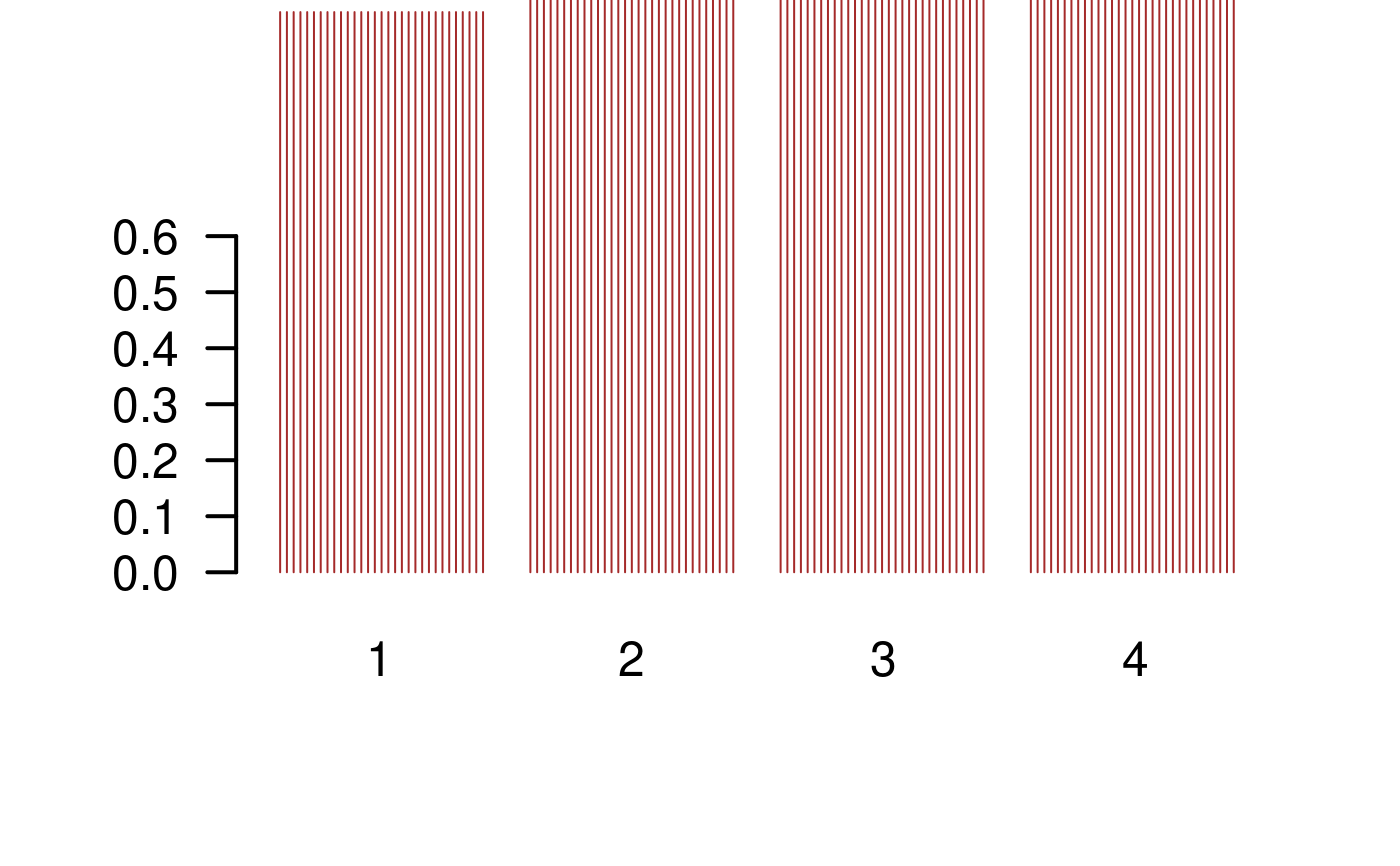
It plots bars of the averages of treatments to compare. It uses the objects generated by a procedure of comparison like LSD, HSD, Kruskall, Waller-Duncan, Friedman or Durbin. It can also display the 'average' value over each bar in a bar chart.
x: data frame formed by 5 columns: name of the bars, height and level of the bar.
bar.group(x, horiz = FALSE, ...)

# S3 method for default
bar.group(x, horiz = FALSE, ...)
Arguments
| x | Object created by a test of comparison |
|---|---|
| horiz | Horizontal or vertical bars |
| ... | Parameters of the function barplot() |
Value
A list with numeric vectors giving the coordinates of all the bar midpoints drawn.
x eje-1 coordinate #' @return height eje-2 coordinate by group
See also
Examples
# Example 1 library(agricolae) data(sweetpotato) model<-aov(yield~virus,data=sweetpotato) comparison<- LSD.test(model,"virus",alpha=0.01,group=TRUE) print(comparison$groups)#> yield groups #> oo 36.90000 a #> ff 36.33333 a #> cc 24.40000 ab #> fc 12.86667 boldpar<-par(cex=1.5) bar.group(comparison$groups,horiz=TRUE,density=8,col="blue",border="red", xlim=c(0,50),las=1)# Example 2 library(agricolae) x <- 1:4 y <- c(0.29, 0.44, 0.09, 0.49) xy <- data.frame(x,y,y) par(oldpar) oldpar<-par(cex=1.5) bar.group(xy,density=30,angle=90,col="brown",border=FALSE,ylim=c(0,0.6),lwd=2,las=1)par(oldpar)

