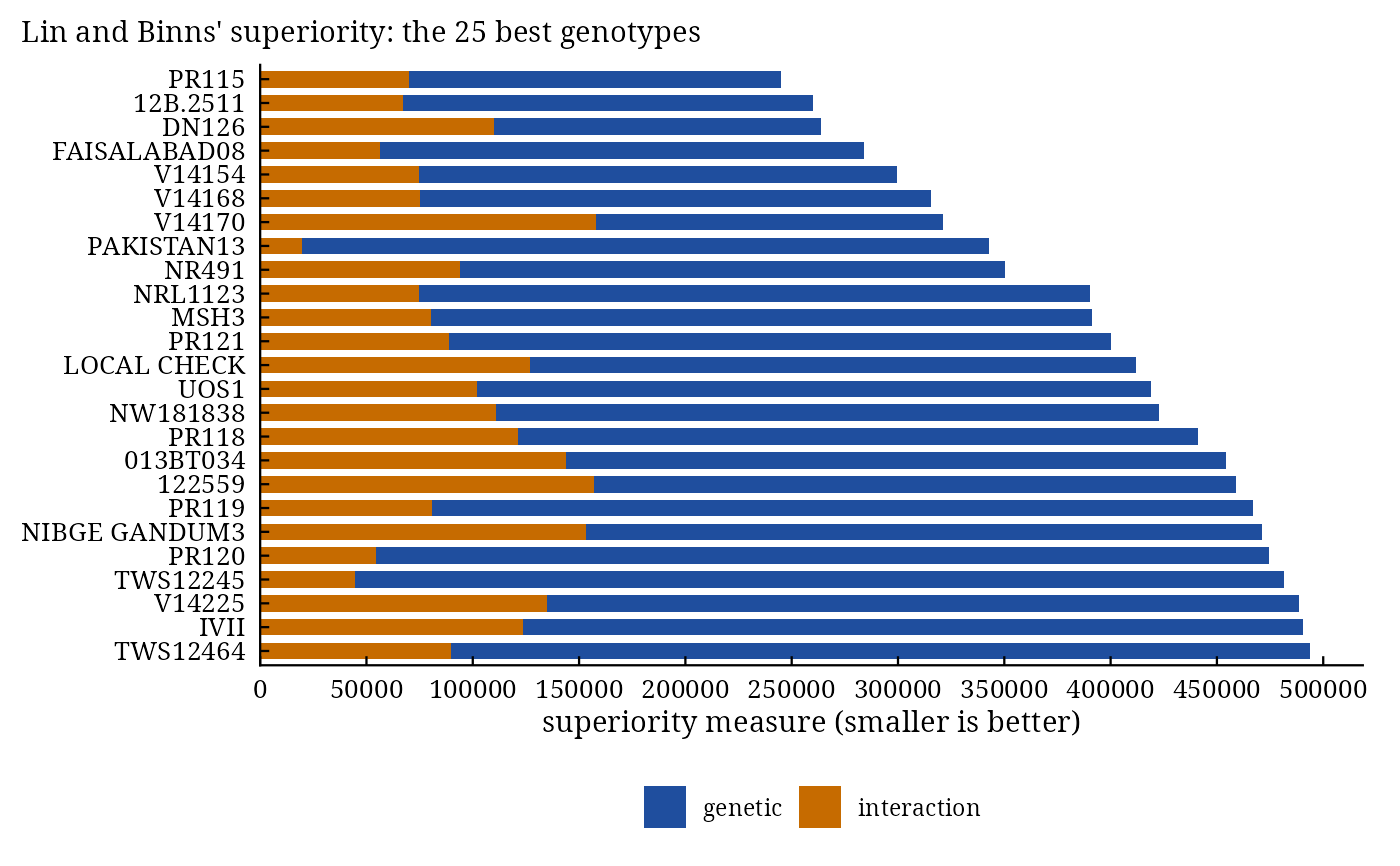
stab_superiority() computes the cultivar superiority measure \(P_i\) of Lin and Binns (1988): the mean
squared distance between a genotype and the best genotype of each environment. A small \(P_i\) marks a
genotype that is close to the best everywhere, so the measure combines yield and stability in one number. It is
split into a genotype part (distance of the genotype's mean from the mean of the best) and an interaction part.
Usage
stab_superiority(.data, .y, .rep, .gen, .env, higher_better = TRUE)

# Default S3 method
stab_superiority(.data, .y, .rep, .gen, .env, higher_better = TRUE)
Arguments
- .data
a data frame (or
data.table) with one row per plot.- .y
response: a column of
.datagiven by name (.y = Yieldor.y = "Yield") or a numeric vector of lengthnrow(.data).- .rep
replicate: not used (kept for compatibility); may be omitted.
- .gen
genotype: a column of
.dataor a vector, as for.y.- .env
environment: a column of
.dataor a vector, as for.y.- higher_better
TRUE(default) when larger values of the trait are better.
Value
An object of class c("stab_superiority", "stab_result", "list"):
Superioritydata.tablesorted byPi:Gen,Mean,Pi,Pi.Gen(genetic part),Pi.GE(interaction part),rPi(rank, 1 = best).
Methods: print(), summary(), plot(), stab_interpret().
Details
With \(M_j = \max_i \bar{y}_{ij}\) the best mean of environment \(j\) (the smallest when
higher_better = FALSE),
$$P_i = \frac{\sum_j(\bar{y}_{ij} - M_j)^2}{2E} = \underbrace{\frac{E(\bar{y}_{i\cdot} - \bar{M})^2}{2E}}_{
\mathrm{genetic}} + \underbrace{\frac{\sum_j(\bar{y}_{ij} - \bar{y}_{i\cdot} - M_j + \bar{M})^2}{2E}}_{
\mathrm{interaction}},$$
with \(\bar{M}\) the mean of the \(M_j\). Genotypes with the smallest \(P_i\) are the most
desirable; a large interaction part shows that a genotype is close to the best in some environments only.
References
Lin, C. S. and Binns, M. R. (1988). A superiority measure of cultivar performance for cultivar x location data. Canadian Journal of Plant Science, 68(1), 193–198.
See also
stab_reliability, stab_eskridge, stab_interpret
Other stability analyses:
add_anova(),
ammi(),
ammi_biplot(),
er_anova(),
ge_effects(),
ge_means(),
gge_biplot(),
indiv_anova(),
stab_asv(),
stab_dist(),
stab_eskridge(),
stab_fox(),
stab_huehn(),
stab_kang(),
stab_masv(),
stab_measures(),
stab_par(),
stab_reg(),
stab_reliability()
Author
Muhammad Yaseen (myaseen208@gmail.com), Kent M. Eskridge (keskridge1@unl.edu)
Examples
data(ge_data)
fit <-
  stab_superiority(
      .data         = ge_data
    , .y            = Yield
    , .rep          = Rep
    , .gen          = Gen
    , .env          = Env
    , higher_better = TRUE
    )
head(fit$Superiority)
#>             Gen     Mean       Pi   Pi.Gen     Pi.GE   rPi
#>          <char>    <num>    <num>    <num>     <num> <int>
#> 1:        PR115 4444.273 244805.8 174721.1  70084.71     1
#> 2:     12B.2511 4414.409 259870.6 192820.5  67050.09     2
#> 3:        DN126 4480.864 263678.2 153760.3 109917.92     3
#> 4: FAISALABAD08 4360.591 284017.6 227689.8  56327.80     4
#> 5:       V14154 4364.727 299476.0 224907.1  74568.92     5
#> 6:       V14168 4342.045 315412.2 240376.6  75035.64     6
plot(x = fit)