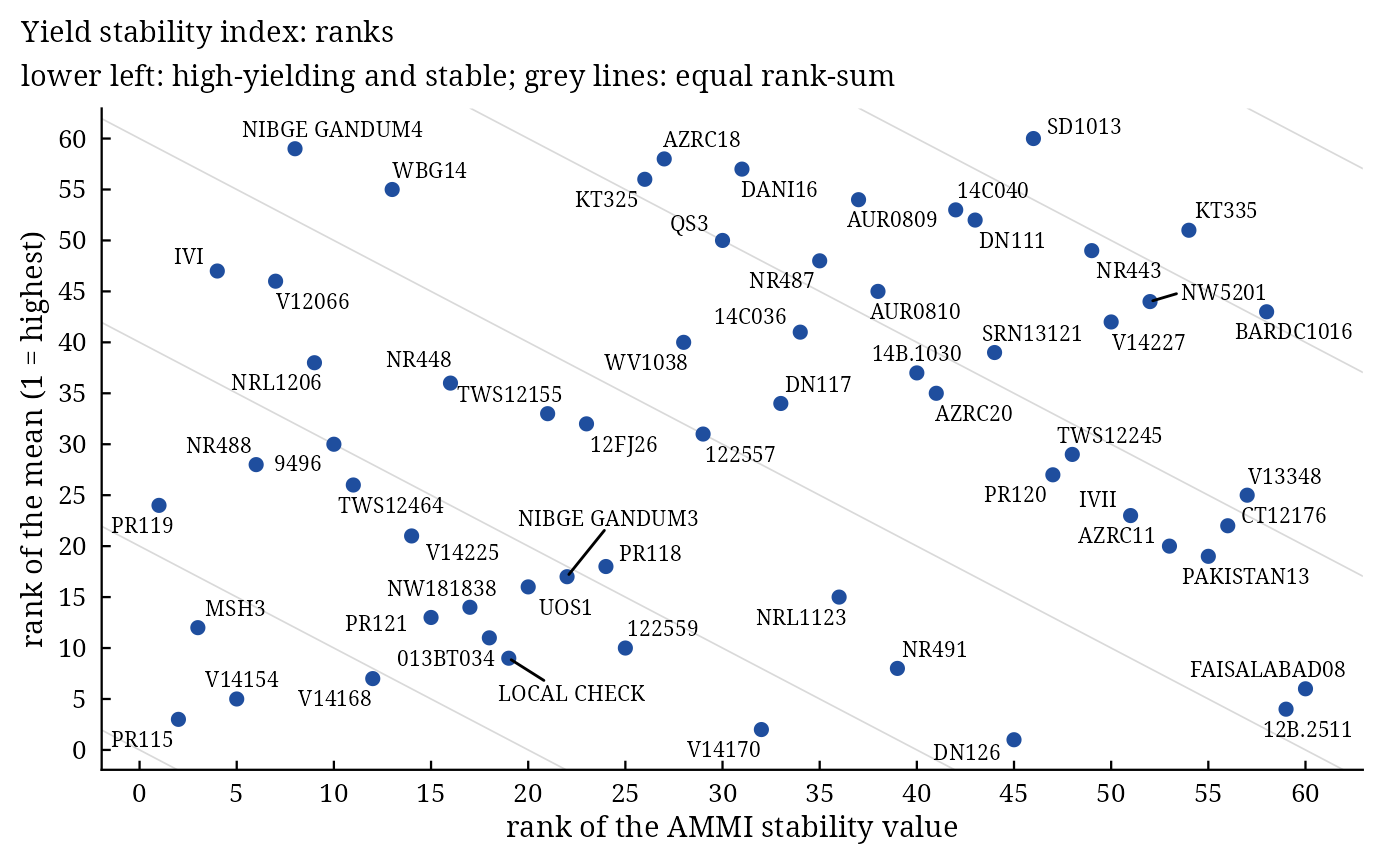
stab_asv() computes the AMMI stability value (ASV) of Purchase et al. (2000), which combines the genotype
scores of the first two AMMI axes weighted by the share of the interaction each axis explains, and the yield
stability index (YSI) of Farshadfar (2008), the sum of the ranks of the ASV and of the mean.
Usage
stab_asv(.data, .y, .rep, .gen, .env)

# Default S3 method
stab_asv(.data, .y, .rep, .gen, .env)
Arguments
- .data
a data frame (or
data.table) with one row per plot.- .y
response: a column of
.datagiven by name (.y = Yieldor.y = "Yield") or a numeric vector of lengthnrow(.data).- .rep
replicate: not used (kept for compatibility); may be omitted.
- .gen
genotype: a column of
.dataor a vector, as for.y.- .env
environment: a column of
.dataor a vector, as for.y.
Value
An object of class c("stab_asv", "stab_result", "list") with the component of earlier versions:
ASDdata.tablesorted by YSI:Gen,Mean,ASD(the ASV),rMean,rASD,YSI; new columnsPC1,PC2(the scores).
Methods: print(), summary(), plot() (which = c("ranks", "mean")),
stab_interpret().
Details
With the AMMI genotype scores \(PC_{i1}\), \(PC_{i2}\) (ammi) and the sums of
squares \(SS_1\), \(SS_2\) of the two axes (\(SS_n \propto \lambda_n^2\)),
$$ASV_i = \sqrt{\left(\frac{SS_1}{SS_2}PC_{i1}\right)^2 + PC_{i2}^2}, \qquad YSI_i = R(ASV_i) +
R(\bar{y}_{i\cdot}),$$
where \(R(ASV_i) = 1\) for the smallest ASV (the most stable genotype) and
\(R(\bar{y}_{i\cdot}) = 1\) for the highest mean. The genotype with the smallest YSI is the most
desirable. The formula is the one used by agricolae and metan.
Changes from the earlier version. The weight was the ratio of the singular values \(\lambda_1/\lambda_2\) applied to the squared score, instead of the ratio of the sums of squares applied to the score; and the stability values were paired with other genotypes' means unless the data were sorted by genotype.
References
Purchase, J. L., Hatting, H. and van Deventer, C. S. (2000). Genotype x environment interaction of winter wheat (Triticum aestivum L.) in South Africa: II. Stability analysis of yield performance. South African Journal of Plant and Soil, 17(3), 101–107.
Farshadfar, E. (2008). Incorporation of AMMI stability value and grain yield in a single non-parametric index (GSI) in bread wheat. Pakistan Journal of Biological Sciences, 11(14), 1791–1796.
See also
stab_masv, stab_dist, ammi, stab_interpret
Other stability analyses:
add_anova(),
ammi(),
ammi_biplot(),
er_anova(),
ge_effects(),
ge_means(),
gge_biplot(),
indiv_anova(),
stab_dist(),
stab_eskridge(),
stab_fox(),
stab_huehn(),
stab_kang(),
stab_masv(),
stab_measures(),
stab_par(),
stab_reg(),
stab_reliability(),
stab_superiority()
Author
Muhammad Yaseen (myaseen208@gmail.com), Kent M. Eskridge (keskridge1@unl.edu)
Examples
data(ge_data)
fit <-
  stab_asv(
      .data = ge_data
    , .y    = Yield
    , .rep  = Rep
    , .gen  = Gen
    , .env  = Env
    )
head(fit$ASD)
#>            Gen     Mean       ASD rMean  rASD   YSI        PC1        PC2
#>         <char>    <num>     <num> <int> <int> <int>      <num>      <num>
#> 1:       PR115 4444.273 1.1235033     3     2     5 -0.9031507  0.4057644
#> 2:      V14154 4364.727 2.6556975     5     5    10 -0.1647526 -2.6488118
#> 3:        MSH3 4247.045 1.9014683    12     3    15  1.2330175 -1.2529001
#> 4:      V14168 4342.045 5.6958779     7    12    19  4.7800620 -1.3024826
#> 5:       PR119 4156.727 0.6095297    24     1    25  0.1556221 -0.5821833
#> 6: LOCAL CHECK 4280.136 7.7084442     9    19    28  1.6384767 -7.4704480
plot(x = fit, which = c("ranks", "mean")[1])