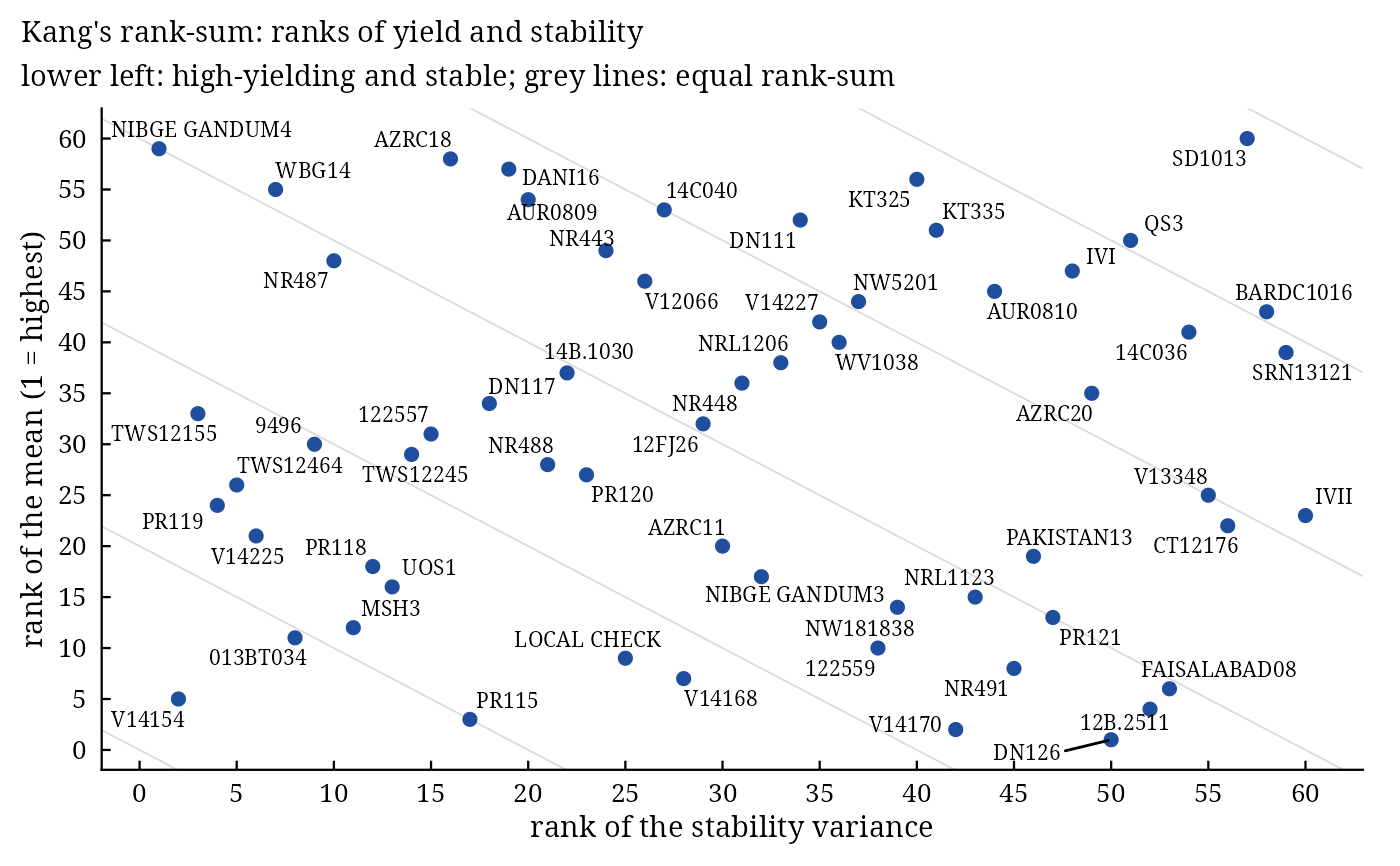
stab_kang() ranks the genotypes by mean (1 = highest) and by Shukla's stability variance (1 = smallest) and
adds the two ranks (Kang 1988); the genotype with the smallest rank-sum combines high yield with stability.
Usage
stab_kang(.data, .y, .rep, .gen, .env)

# Default S3 method
stab_kang(.data, .y, .rep, .gen, .env)
Arguments
- .data
a data frame (or
data.table) with one row per plot.- .y
response: a column of
.datagiven by name (.y = Yieldor.y = "Yield") or a numeric vector of lengthnrow(.data).- .rep
replicate: not used (kept for compatibility); may be omitted.
- .gen
genotype: a column of
.dataor a vector, as for.y.- .env
environment: a column of
.dataor a vector, as for.y.
Value
An object of class c("stab_kang", "stab_result", "list") with the component of earlier versions:
Kangdata.tablesorted by rank-sum:Gen,Mean,ShuklaVar,rMean,rShukaVar(rank of the stability variance; the name of earlier versions),rStab(rank-sum).
Methods: print(), summary(), plot() (ranks of yield and stability), stab_interpret().
Details
$$RS_i = R(\bar{y}_{i\cdot}) + R(\sigma^2_i),$$
with \(R(\bar{y}_{i\cdot}) = 1\) for the highest mean, \(R(\sigma^2_i) = 1\) for
the smallest stability variance (see stab_measures); ties take the smallest rank. Both parts weigh
equally.
Change from the earlier version. The earlier version paired the means (in the order of the data) with the stability variances (in the order of the genotype levels), so the stability variance and its rank belonged to another genotype unless the data were sorted by genotype.
References
Kang, M. S. (1988). A rank-sum method for selecting high-yielding, stable corn genotypes. Cereal Research Communications, 16(1–2), 113–115.
Shukla, G. K. (1972). Some statistical aspects of partitioning genotype-environmental components of variability. Heredity, 29(2), 237–245. doi:10.1038/hdy.1972.87
See also
stab_par (Kang's yield-stability statistic), stab_interpret
Other stability analyses:
add_anova(),
ammi(),
ammi_biplot(),
er_anova(),
ge_effects(),
ge_means(),
gge_biplot(),
indiv_anova(),
stab_asv(),
stab_dist(),
stab_eskridge(),
stab_fox(),
stab_huehn(),
stab_masv(),
stab_measures(),
stab_par(),
stab_reg(),
stab_reliability(),
stab_superiority()
Author
Muhammad Yaseen (myaseen208@gmail.com), Kent M. Eskridge (keskridge1@unl.edu)
Examples
data(ge_data)
fit <-
  stab_kang(
      .data = ge_data
    , .y    = Yield
    , .rep  = Rep
    , .gen  = Gen
    , .env  = Env
    )
head(fit$Kang)
#>         Gen     Mean ShuklaVar rMean rShukaVar rStab
#>      <char>    <num>     <num> <int>     <int> <int>
#> 1:   V14154 4364.727  58121.11     5         2     7
#> 2: 013BT034 4247.500  94993.42    11         8    19
#> 3:    PR115 4444.273 122904.01     3        17    20
#> 4:     MSH3 4247.045 110234.85    12        11    23
#> 5:   V14225 4194.182  93059.17    21         6    27
#> 6:    PR119 4156.727  68111.66    24         4    28
plot(x = fit)