Stability parameters with Shukla's tests and Kang's yield-stability statistic
Source:R/stab_par.R
stab_par.Rdstab_par() gives Shukla's (1972) analysis of the genotype-by-environment interaction (its split into a
heterogeneity part explained by an environmental covariate and a residual), the stability parameters of every
genotype with \(F\) tests of Shukla's stability variance, and Kang's (1993) yield-stability statistic
\(YS_i\) for selecting genotypes that are high-yielding and stable at the same time.
Usage
stab_par(.data, .y, .rep, .gen, .env, alpha = 0.1, .envCov = NULL)

# Default S3 method
stab_par(.data, .y, .rep, .gen, .env, alpha = 0.1, .envCov = NULL)
Arguments
- .data
a data frame (or
data.table) with one row per plot.- .y
response: a column of
.datagiven by name (.y = Yieldor.y = "Yield") or a numeric vector of lengthnrow(.data).- .rep
replicate (block within environment): a column of
.dataor a vector, as for.y.- .gen
genotype: a column of
.dataor a vector, as for.y.- .env
environment: a column of
.dataor a vector, as for.y.- alpha
level of the weakest significance that lowers the stability rating by 2 (default
0.1).- .envCov
environmental covariate: a column of
.data(or a vector of lengthnrow(.data)) with one value per environment (rainfall, an index measured independently);NULL(default) uses the environment index.
Value
An object of class c("stab_par", "stab_result", "list") with the components of earlier versions:
ANOVAanalysis of variance (class
anova):Total,Gen,Env,Gen x Env,Heterogeneity,Residual,Pooled error.StabPardata.table:Gen,Mean,GenSS,Var,CV,Ecov,GE.SS,GE.MSE,Sigma(\(\sigma^2_i\)),.(its test),SP(\(s^2_i\)),..(its test); new columnsp.Sigmaandp.SP.SimultSeldata.tablesorted byYSi:Gen,Mean,Rank,Adjustment,Adj.Rank,Sigma,Stab.Rating,YSi,Select("+"selected).
Methods: print(), summary(), plot() (which = c("ys", "sigma")),
stab_interpret().
Details
Stability parameters (on the scale of the means; see stab_measures): the mean, the sum of
squares, variance and CV over environments, Wricke's ecovalence \(W_i\), Shukla's stability variance
\(\sigma^2_i\), and Shukla's \(s^2_i\), the stability variance left after removing the linear
effect of a covariate \(c_j\) (the environment index \(\bar{y}_{\cdot j} - \bar{y}\) when no
covariate is given): with \(\hat{b}_i = \sum_j z_{ij}(c_j - \bar{c})/\sum_j(c_j - \bar{c})^2\) and \(S_i = \sum_j(z_{ij} - \hat{b}_i(c_j - \bar{c}))^2\),
$$s^2_i = \frac{G}{(G - 2)(E - 2)}\left(S_i - \frac{\sum_k S_k}{G(G - 1)}\right).$$
Each is tested by \(F = \sigma^2_i/(s^2/B)\) (respectively \(s^2_i/(s^2/B)\))
on \(E - 1\) (\(E - 2\)) and \(f_e\) degrees of freedom; the columns . and
.. code the result: ns, * (\(p < 0.05\)), ** (\(p < 0.01\)).
Analysis of variance (on the scale of the plots): genotypes, environments and interaction; the interaction split into heterogeneity (\(G - 1\) degrees of freedom; \(B\sum_i\hat{b}_i^2\sum_j(c_j - \bar{c})^2\)) and residual (\((G - 1)(E - 2)\); \(B\sum_i S_i\)); and the pooled error.
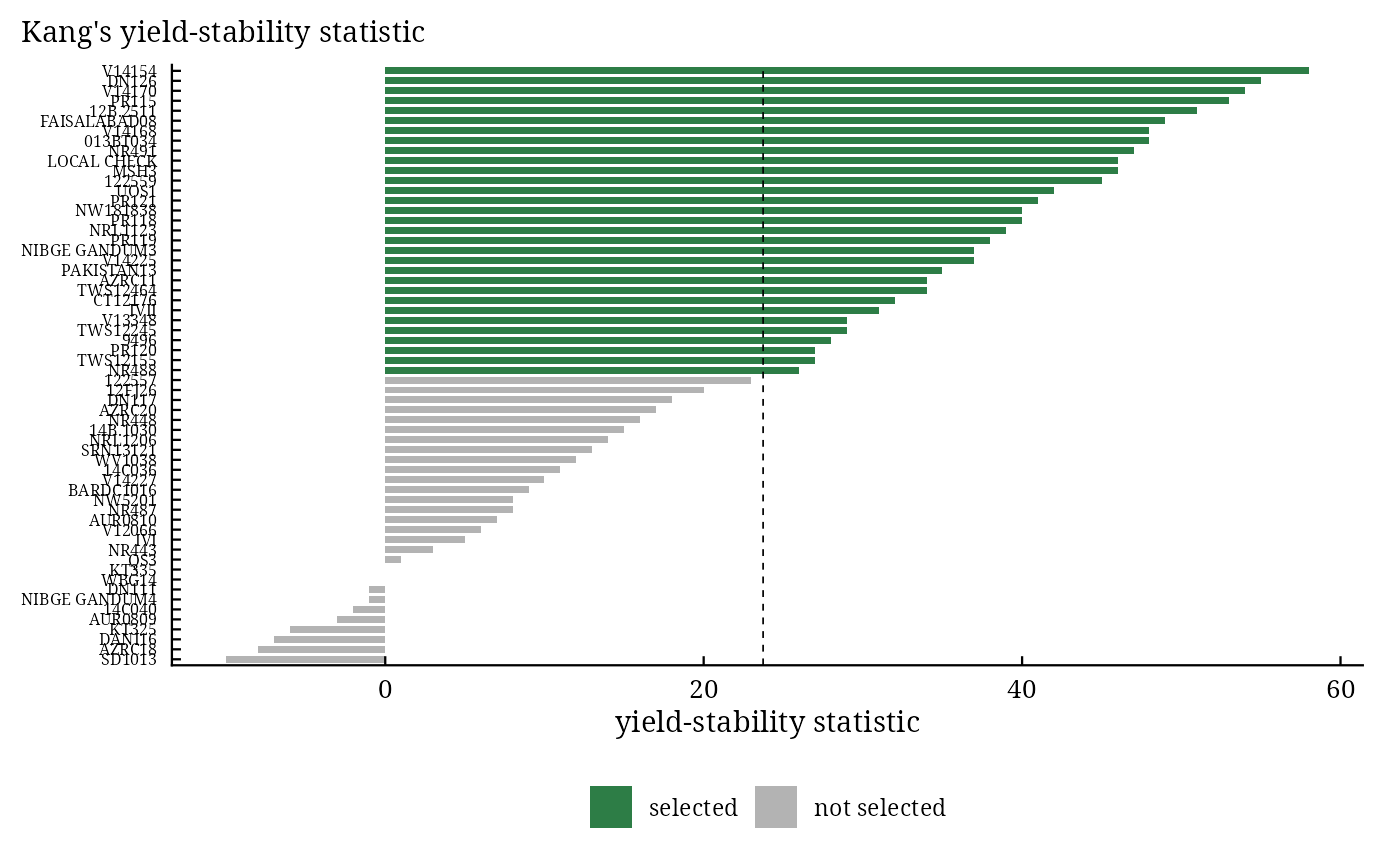
Kang's yield-stability statistic. Rank the means in ascending order (the highest mean gets rank
\(G\)); with \(LSD = t_{0.025, f_e}\sqrt{2s^2/(BE)}\) add +1, +2 or +3
when the mean exceeds the grand mean by less than one, at least one, or at least two LSD, and -1, -2 or -3 when it
is below it by less than one, at least one, or at least two LSD; add the stability rating -8, -4 or -2 when
\(\sigma^2_i\) is significant at 0.01, 0.05 or alpha (0 otherwise). Genotypes with \(YS_i\)
above the mean of \(YS\) are selected.
Changes from the earlier version. The stability parameters were divided by the number of replicates (the
means, variances and coefficients of variation too); the pooled error had \((G - 1)^2E\) degrees of
freedom; the stability rating for significance at alpha was +2 instead of -2; the LSD used a one-sided
\(t\); a covariate given in .envCov was used plot by plot instead of once per environment. All are
corrected.
References
Shukla, G. K. (1972). Some statistical aspects of partitioning genotype-environmental components of variability. Heredity, 29(2), 237–245. doi:10.1038/hdy.1972.87
Kang, M. S. and Pham, H. N. (1991). Simultaneous selection for high yielding and stable crop genotypes. Agronomy Journal, 83(1), 161–165. doi:10.2134/agronj1991.00021962008300010037x
Kang, M. S. (1993). Simultaneous selection for yield and stability in crop performance trials: consequences for growers. Agronomy Journal, 85(3), 754–757.
See also
stab_measures, stab_kang, stab_interpret
Other stability analyses:
add_anova(),
ammi(),
ammi_biplot(),
er_anova(),
ge_effects(),
ge_means(),
gge_biplot(),
indiv_anova(),
stab_asv(),
stab_dist(),
stab_eskridge(),
stab_fox(),
stab_huehn(),
stab_kang(),
stab_masv(),
stab_measures(),
stab_reg(),
stab_reliability(),
stab_superiority()
Author
Muhammad Yaseen (myaseen208@gmail.com), Kent M. Eskridge (keskridge1@unl.edu)
Examples
data(ge_data)
fit <-
  stab_par(
      .data   = ge_data
    , .y      = Yield
    , .rep    = Rep
    , .gen    = Gen
    , .env    = Env
    , alpha   = 0.1
    , .envCov = NULL
    )
fit$ANOVA
#>                  Df    Sum Sq  Mean Sq  F value    Pr(>F)
#> Total           659 536939402
#> Gen              59  71662431  1214617   3.7143 3.937e-16 ***
#> Env              10 263940496 26394050 266.1568 < 2.2e-16 ***
#> Gen x Env       590 201336476   341248   3.4411 < 2.2e-16 ***
#>   Heterogeneity  59  27695329   469412   1.4355   0.02256 *
#>   Residual      531 173641147   327008   3.2975 < 2.2e-16 ***
#> Pooled error    649  64359568    99167
#> ---
#> Signif. codes:  0 ‘***’ 0.001 ‘**’ 0.01 ‘*’ 0.05 ‘.’ 0.1 ‘ ’ 1
head(fit$SimultSel)
#>             Gen     Mean  Rank Adjustment Adj.Rank     Sigma Stab.Rating   YSi
#>          <char>    <num> <int>      <int>    <int>     <num>       <int> <int>
#> 1:       V14154 4364.727    56          2       58  58121.11           0    58
#> 2:        DN126 4480.864    60          3       63 231116.61          -8    55
#> 3:       V14170 4463.818    59          3       62 199533.08          -8    54
#> 4:        PR115 4444.273    58          3       61 122904.01          -8    53
#> 5:     12B.2511 4414.409    57          2       59 255149.62          -8    51
#> 6: FAISALABAD08 4360.591    55          2       57 257374.96          -8    49
#>    Select
#>    <char>
#> 1:      +
#> 2:      +
#> 3:      +
#> 4:      +
#> 5:      +
#> 6:      +
plot(x = fit, which = c("ys", "sigma")[1])