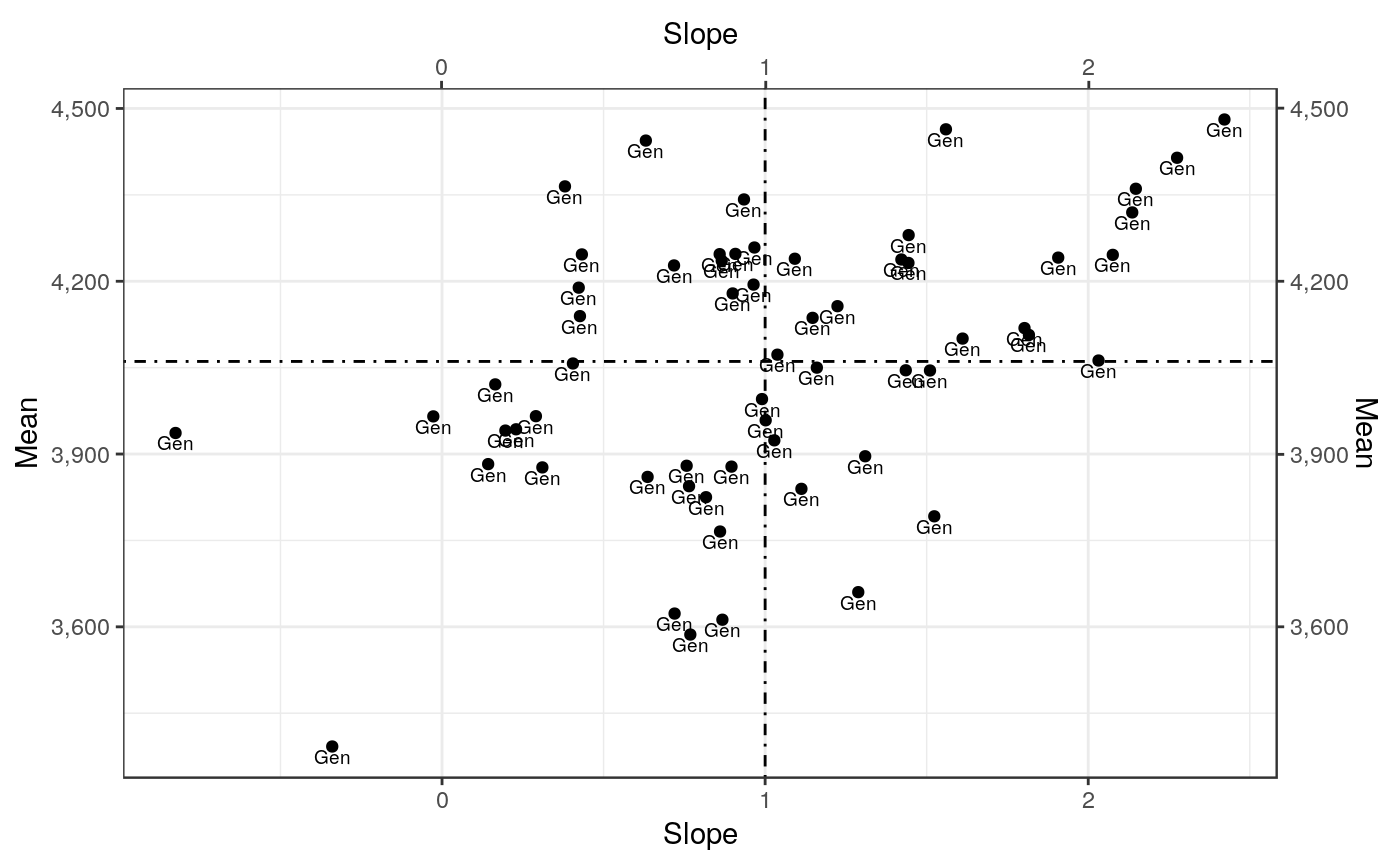
Individual Regression for each Genotype in Genotypes by Environment Interaction (GEI)
Usage
stab_reg(.data, .y, .rep, .gen, .env)

# Default S3 method
stab_reg(.data, .y, .rep, .gen, .env)References
Singh, R. K. and Chaudhary, B. D. (2004) Biometrical Methods in Quantitative Genetic Analysis. New Delhi: Kalyani.
Author
Muhammad Yaseen (myaseen208@gmail.com)
Kent M. Edkridge (keskridge1@unl.edu)
Examples
data(ge_data)
Yield.StabReg <-
        stab_reg(
            .data = ge_data
          , .y    = Yield
          , .rep  = Rep
          , .gen  = Gen
          , .env  = Env
          )

Yield.StabReg
#> $StabIndvReg
#> # A tibble: 60 × 9
#>    Gen       Mean Slope    LCI   UCI R.Sqr  RMSE      SSE    Delta
#>    <fct>    <dbl> <dbl>  <dbl> <dbl> <dbl> <dbl>    <dbl>    <dbl>
#>  1 013BT034 4248. 0.954  0.460  1.45 0.680  324.  942048.  471024.
#>  2 122557   4062. 1.52   1.13   1.90 0.898  253.  574068.  287034.
#>  3 122559   4259. 0.983  0.301  1.67 0.542  447. 1799675.  899838.
#>  4 12B.2511 4414. 1.64   0.994  2.28 0.787  422. 1600984.  800492.
#>  5 12FJ26   4057. 0.703  0.107  1.30 0.442  391. 1372720.  686360.
#>  6 14B.1030 3995. 0.995  0.407  1.58 0.620  385. 1336946.  668473.
#>  7 14C036   3943. 0.615 -0.143  1.37 0.272  497. 2220530. 1110265.
#>  8 14C040   3825. 0.909  0.297  1.52 0.557  401. 1445024.  722512.
#>  9 9496     4072. 1.02   0.513  1.53 0.698  332.  990414.  495207.
#> 10 AUR0809  3792. 1.26   0.732  1.79 0.764  347. 1083957.  541979.
#> # ℹ 50 more rows
#>
#> $MeanSlopePlot

#>
#>