Stability Measures for Genotypes by Environment Interaction (GEI)
Source:R/stab_measures.R
stab_measures.RdStability Measures for Genotypes by Environment Interaction (GEI)
References
Singh, R. K. and Chaudhary, B. D. (2004) Biometrical Methods in Quantitative Genetic Analysis. New Delhi: Kalyani.
Author
Muhammad Yaseen (myaseen208@gmail.com)
Kent M. Edkridge (keskridge1@unl.edu)
Examples
data(ge_data)
Yield.StabMeasures <- stab_measures(
.data = ge_data
, .y = Yield
, .gen = Gen
, .env = Env
)
Yield.StabMeasures
#> $StabMeasures
#> # A tibble: 60 × 7
#> Gen Mean GenSS Var CV Ecov ShuklaVar
#> <fct> <dbl> <dbl> <dbl> <dbl> <dbl> <dbl>
#> 1 013BT034 4248. 2943754. 294375. 12.8 946707. 94993.
#> 2 122557 4062. 5628712. 562871. 18.5 1159570. 117014.
#> 3 122559 4259. 3926773. 392677. 14.7 1800281. 183294.
#> 4 12B.2511 4414. 7498766. 749877. 19.6 2494884. 255150.
#> 5 12FJ26 4057. 2458450. 245845. 12.2 1567279. 159191.
#> 6 14B.1030 3995. 3515214. 351521. 14.8 1336998. 135368.
#> 7 14C036 3943. 3051351. 305135. 14.0 2547232. 260565.
#> 8 14C040 3825. 3260477. 326048. 14.9 1463435. 148448.
#> 9 9496 4072. 3274386. 327439. 14.1 991210. 99597.
#> 10 AUR0809 3792. 4585671. 458567. 17.9 1234667. 124782.
#> # ℹ 50 more rows
#>
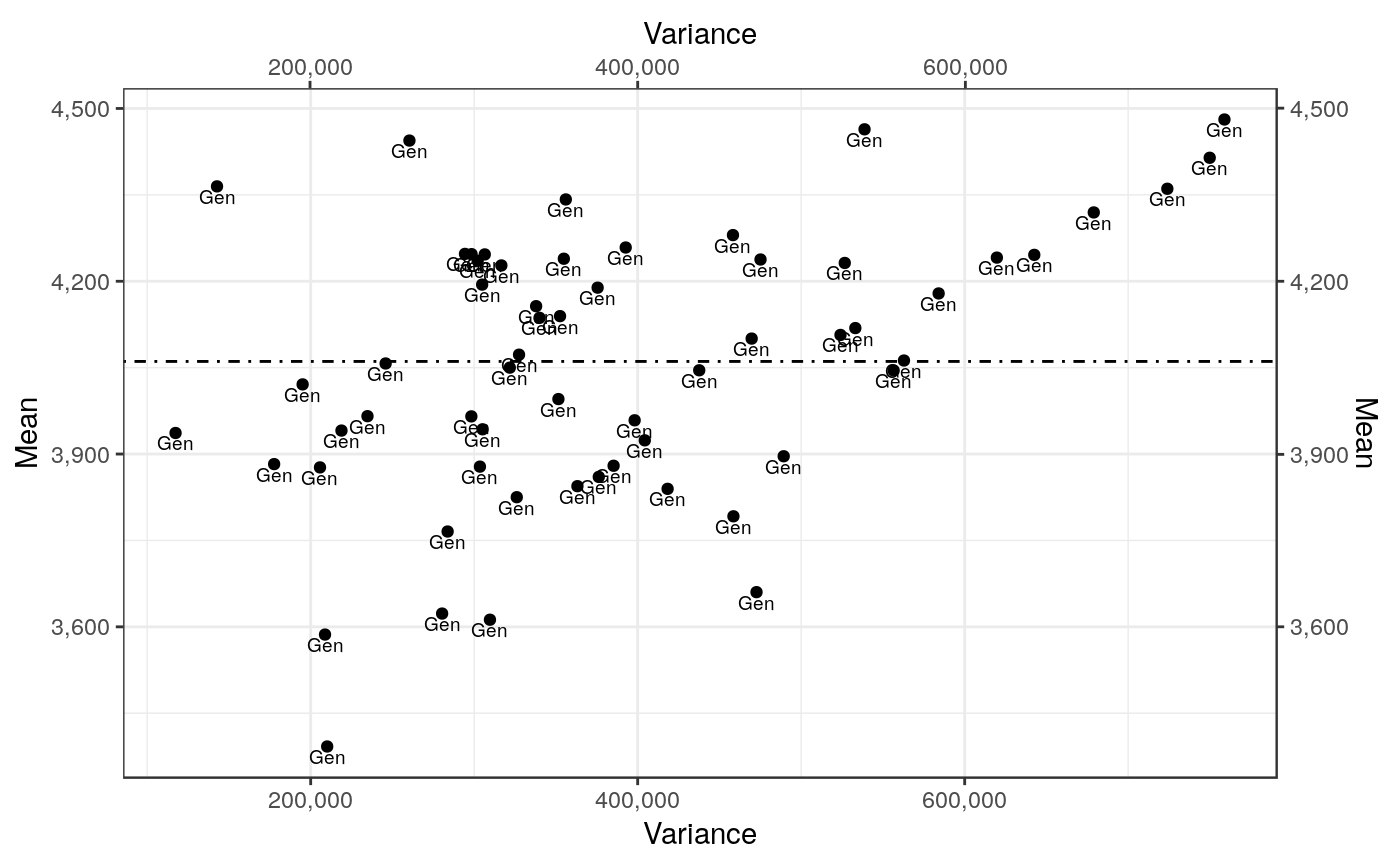
#> $MeanVarPlot
 #>
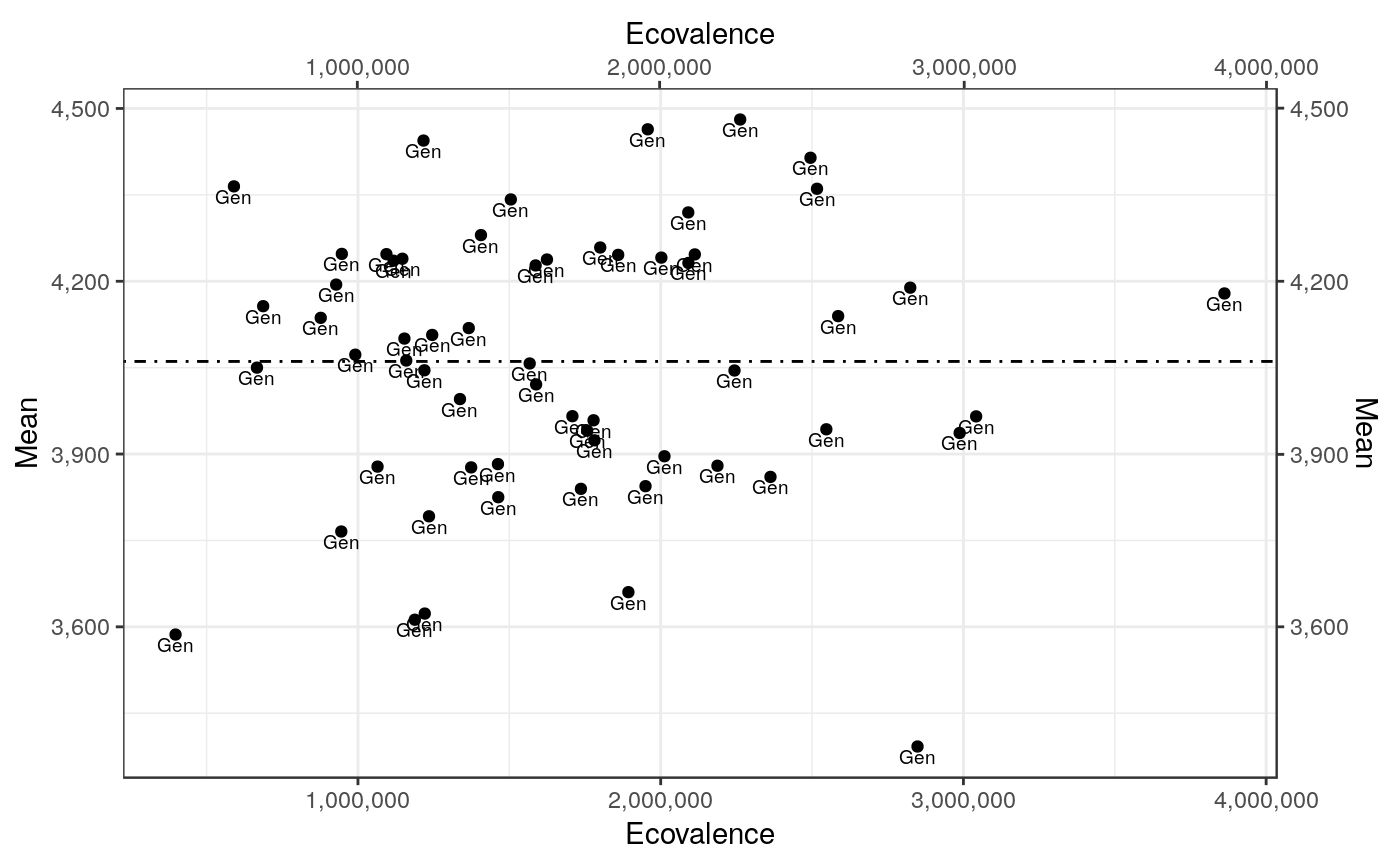
#> $MeanEcovPlot
#>
#> $MeanEcovPlot
 #>
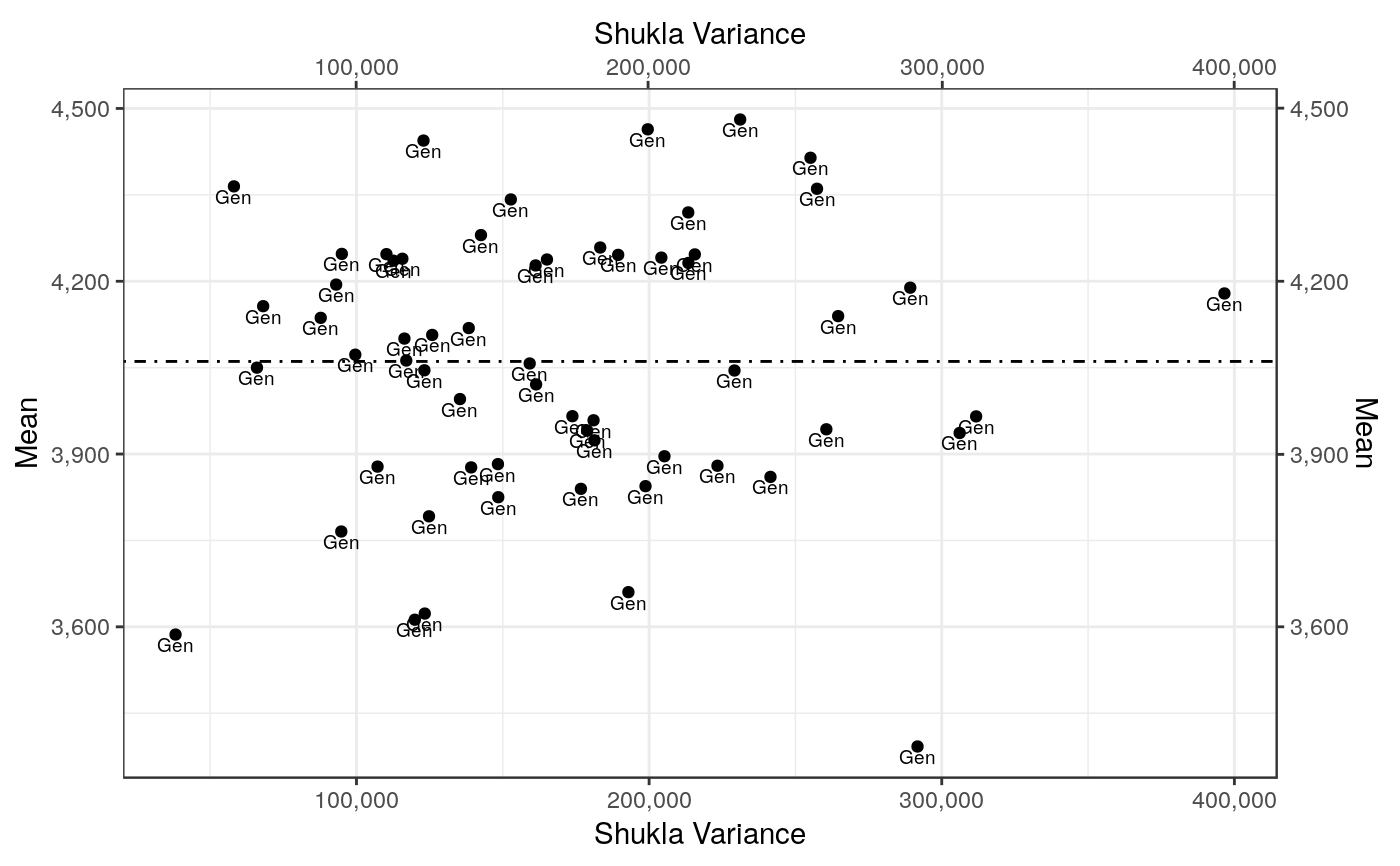
#> $MeanShuklaVarPlot
#>
#> $MeanShuklaVarPlot
 #>
#>