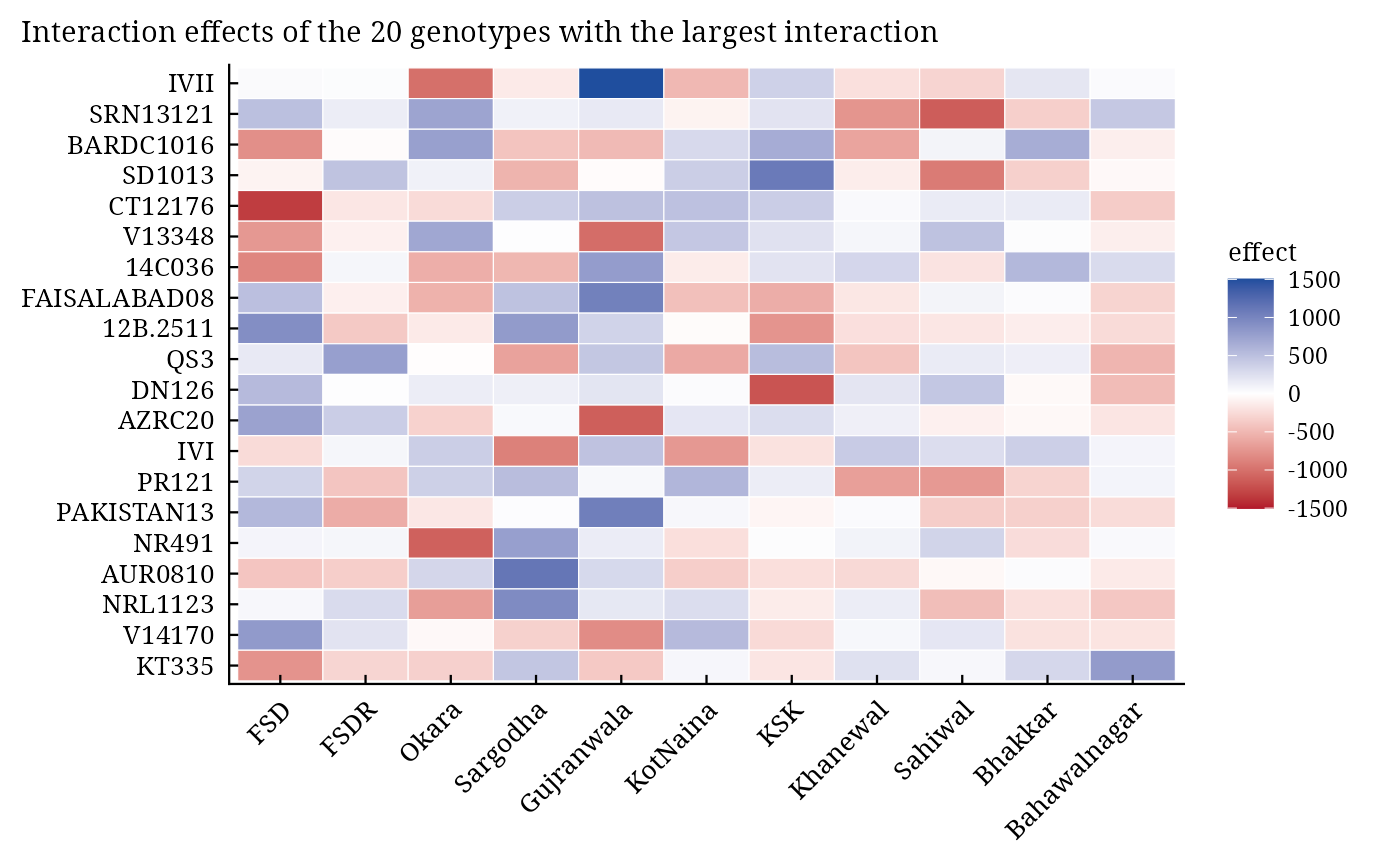
ge_effects() gives the table of means, the genotype-plus-interaction (GGE) effects (means centred on the
environment means) and the interaction (GE) effects (means centred on genotype and environment means). A large
positive interaction effect marks a genotype specifically adapted to that environment.
Value
An object of class c("stab_ge_effects", "stab_result", "list") with the components of earlier
versions:
ge_meansdata.tableof means, genotypes in rows.gge_effectsmatrix of genotype-plus-interaction effects.
ge_effectsmatrix of interaction effects.
Methods: print(), summary(), plot() (which = c("ge", "gge")), stab_interpret().
Details
$$gge_{ij} = \bar{y}_{ij} - \bar{y}_{\cdot j}, \qquad z_{ij} = \bar{y}_{ij} - \bar{y}_{i\cdot} - \bar{y}_{\cdot
j} + \bar{y}.$$
The interaction effects sum to zero over every row and column; their squares summed over a row are Wricke's
ecovalence (stab_measures).
See also
ge_means, ammi, stab_interpret
Other stability analyses:
add_anova(),
ammi(),
ammi_biplot(),
er_anova(),
ge_means(),
gge_biplot(),
indiv_anova(),
stab_asv(),
stab_dist(),
stab_eskridge(),
stab_fox(),
stab_huehn(),
stab_kang(),
stab_masv(),
stab_measures(),
stab_par(),
stab_reg(),
stab_reliability(),
stab_superiority()
Author
Muhammad Yaseen (myaseen208@gmail.com), Kent M. Eskridge (keskridge1@unl.edu)
Examples
data(ge_data)
fit <-
  ge_effects(
      .data = ge_data
    , .y    = Yield
    , .gen  = Gen
    , .env  = Env
    )
round(x = fit$ge_effects[1:5, 1:5], digits = 1)
#>             FSD   FSDR  Okara Sargodha Gujranwala
#> 013BT034   -0.1  273.6  226.3   -283.9     -305.5
#> 122557    249.6   90.7 -652.5    147.3      275.6
#> 122559   -692.1 -125.0  544.7   -114.5      212.9
#> 12B.2511  916.0 -378.3 -146.6    807.2      347.6
#> 12FJ26   -107.8  288.3 -589.9   -579.1      -69.3
plot(x = fit, which = c("ge", "gge")[1])