4 Effectiveness of Education System
In the path to economic development, education has become a central element of the country’s growth strategies. To be effective in the long run, improvements in education need to enable all children to have access to quality education without discrimination, to stay in the system until at least at the end of higher secondary education, and to achieve the skills and knowledge they will need for effective social and labour market integration.
Access, Equity and Quality of education are very important considerations for analyzing the effectiveness of the education system. For each of these important parameters, there are a number of indicators which can determine the level of access, equity and quality in education system.
4.1 Access in Education
4.1.1 Gross Intake Rate (GIR)
Gross Intake Rate (GIR) is defined as total number of new entrants in the first grade of primary education, regardless of age, expressed as a percentage of the population at the official primary school-entrance age.
A high GIR indicates in general a high degree of access to primary education. As this calculation includes all new entrants to the first grade, including over-aged and under-aged children entering primary school for the first time, the value of GIR can be more than 100 percent.
At the national level GIR for 2017-18 remained unchanged at 98 percent. However GIR in the provinces/regions showed increase/decrease. It showed increase in Punjab, AJK and ICT and decrease in all other provinces/regions. GIR for males (105) was 13 percent higher than females (92). This difference was high in KP (20%) and FATA (38%) than other provinces/regions (Fig. 4.1). It was the lowest in Punjab where only one percent difference between male and female GIR was observed.
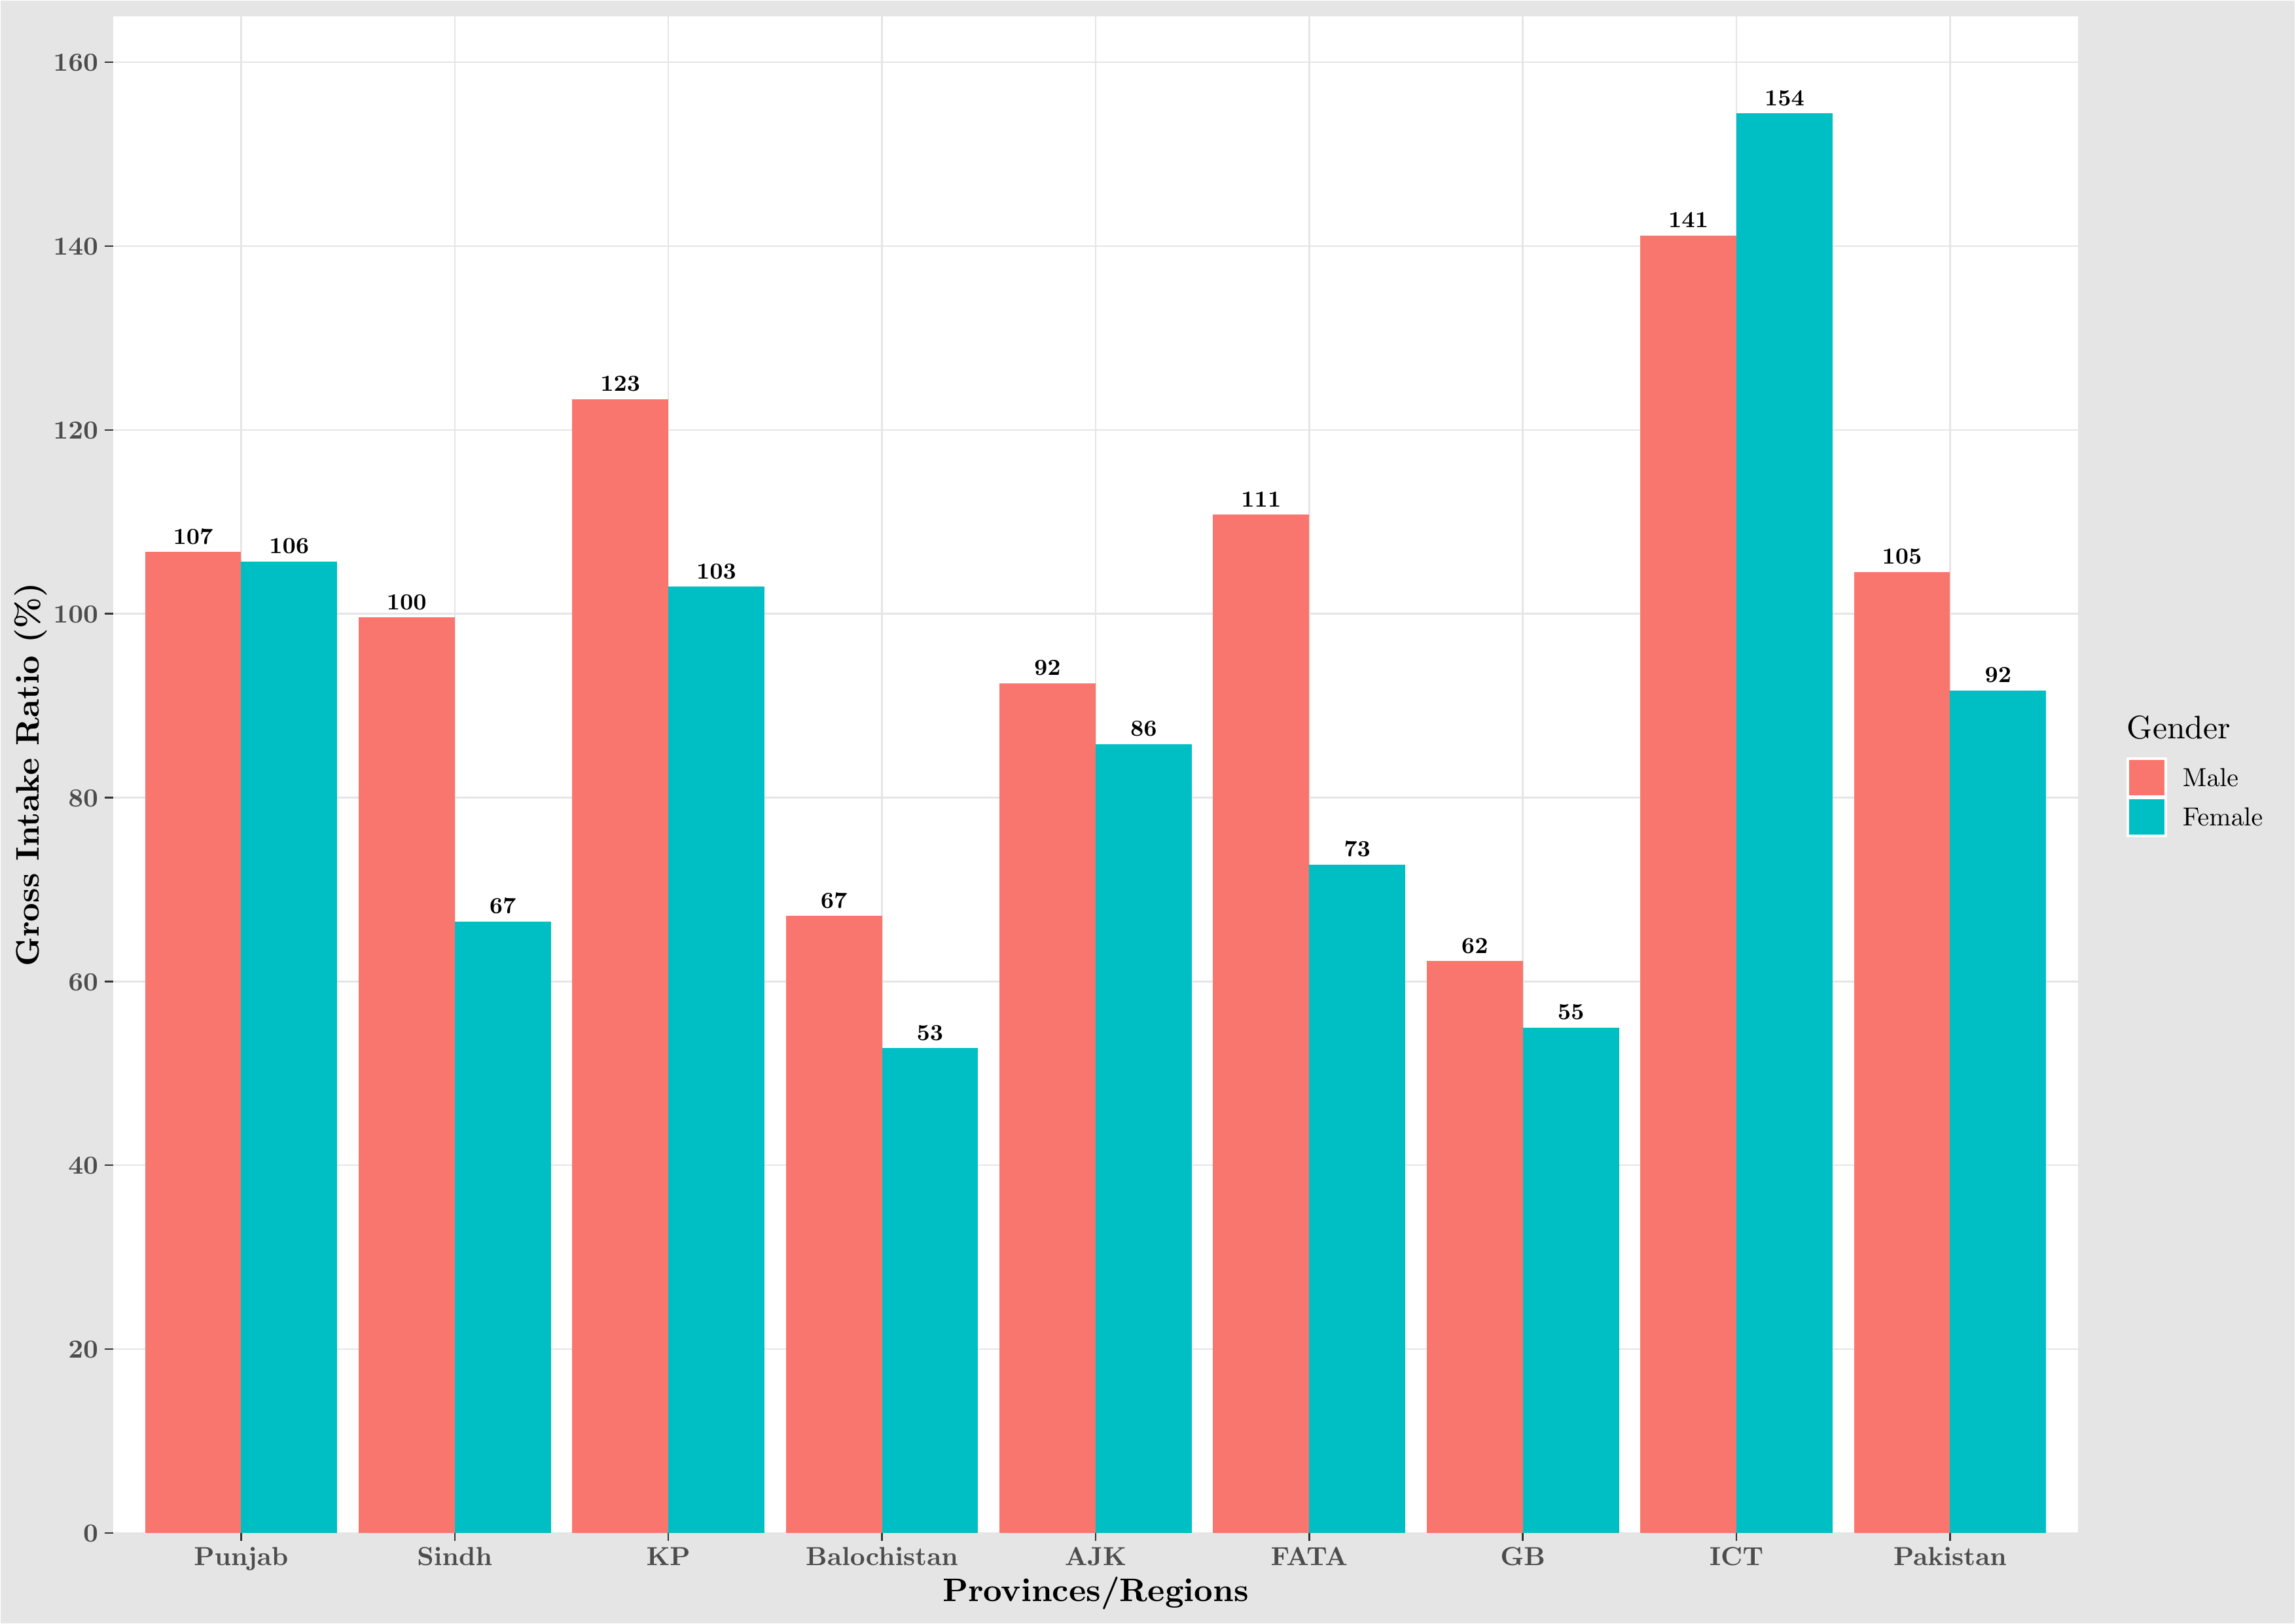
Figure 4.1: GIR by Gender for Provinces/Regions of Pakistan 2017-18
4.1.2 Gross Enrolment Ratio (GER)
The GER is the most commonly used indicator to measure coverage in the education system. GER is defined as the number of students, regardless of age, enrolled in a specific school phase (e.g. primary phase for class 1 to 5) as a percentage of the total appropriate school-age population (e.g. age \(5-9^{+}\) years old for the primary phase). For example, a GER of more than 100 percent indicates that there are more students in the formal schooling system than in the appropriate school-age population (total potential population), which is evidence of enrolment of under-aged and over-aged students owing to early or late entry and grade repetition. It shows the overall coverage of an education system in relation to the population eligible for participation in the enrolment in schools. It is useful for those who are interested in the overall participation rate of the school-age population in a particular education level. It can be used for comparing different provinces, regions, urban and rural, male and female disparities, etc.
Gross enrolment in primary education is 22.931 million with 12.838 million (56%) males and 10.093 million (44%) females. In order to compute GER population of official primary school age is required. Since the Population Census 2017 official figures are yet to be finalized so population projections by NIPS 2005-25 were used for this purpose. According to these projections the projected population figures at national level for age group ( \(5-9^{+}\) years) were 22.572 million with 11.714 million (51.9%) males and 10.858 million (49.1%) females. Resultantly GER for Pakistan is computed as 102 percent and it is 110 and 93 percent for males and females respectively (Fig. 4.2, Primary).
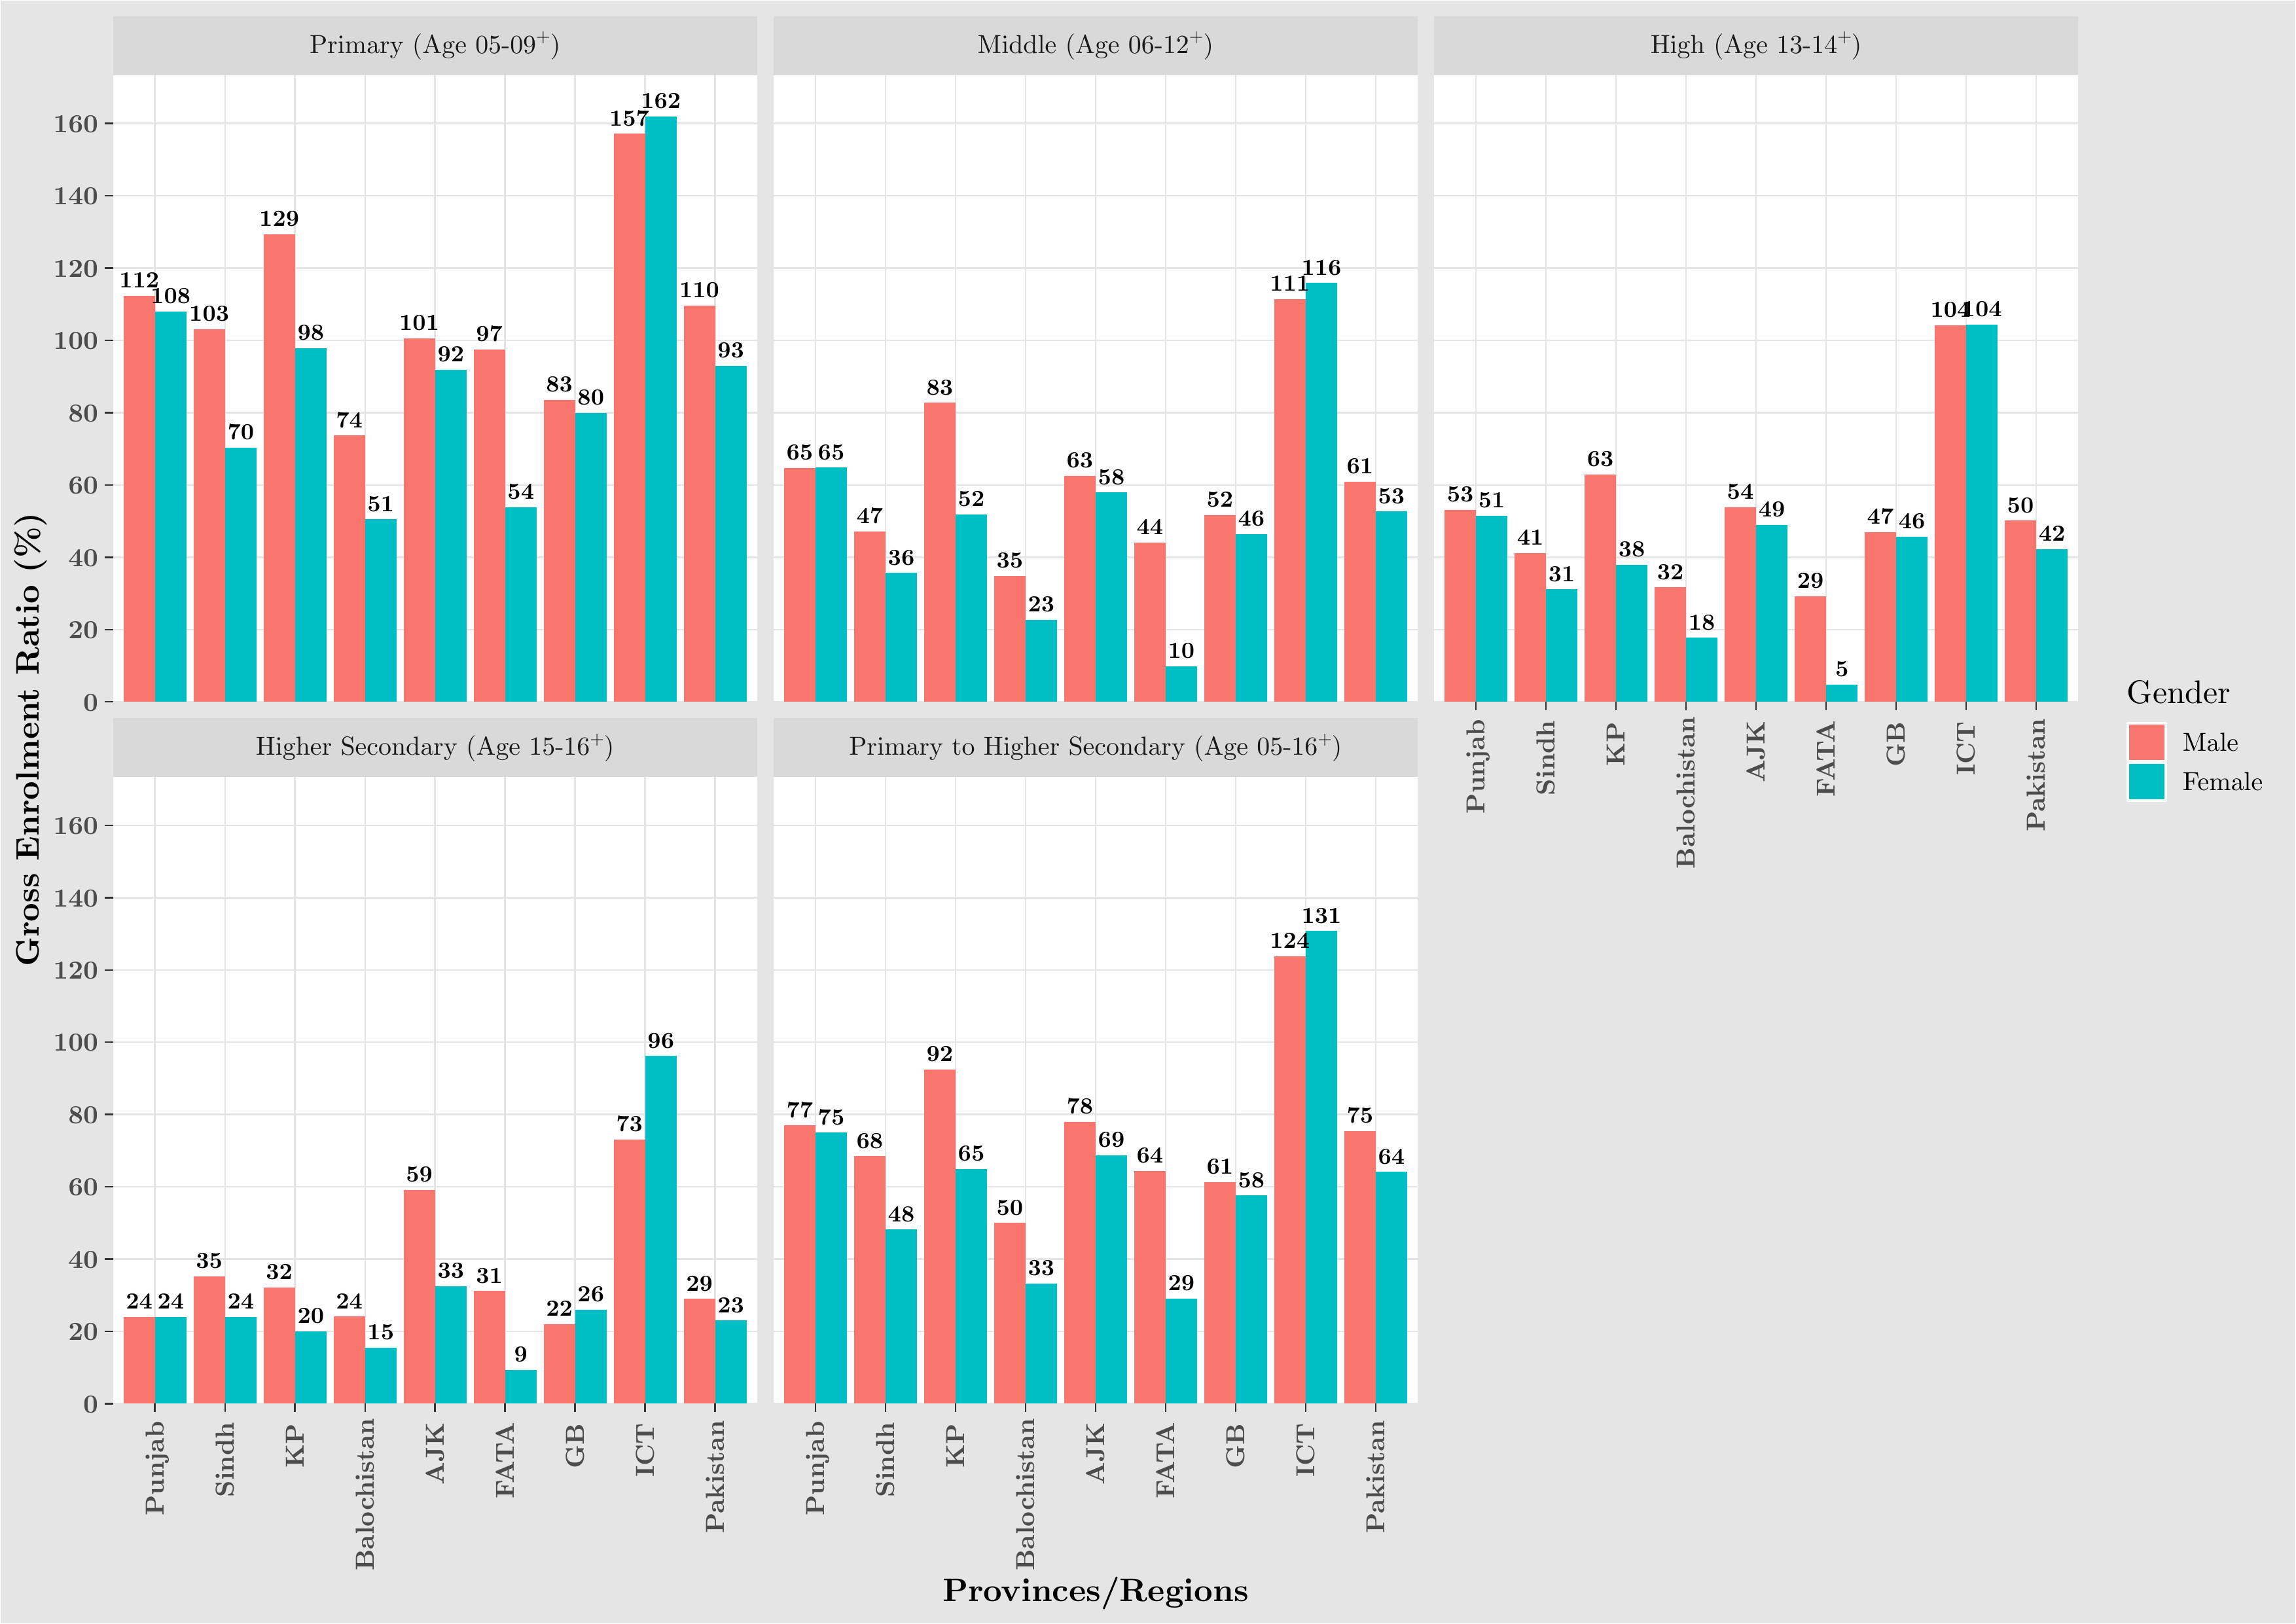
Figure 4.2: GER by Gender and Education levels for Provinces/Regions of Pakistan 2017-18
On the provincial front where four provinces and four regions are decided for reporting in PES-2017-18 there is lot of variation in the GER with the lowest GER of 63 percent observed in Balochistan and the highest of 159 percent in ICT. More than hundred percent GER’s are observed for Punjab (110%) and KP (114%). Similar large scale variation is also observed for males and females. The lowest GER for males 74 percent is observed again in Balochistan with the highest 157 percent in ICT. For females the lowest 51 percent is observed for Balochistan and highest 162 percent for ICT (Fig. 4.2, Primary).
Apart from ICT whose figures are highest both for males and females in the other provinces KP leads the way in terms of higher GER’s for males (129%) followed by Punjab, Sindh and AJK where male GER’s are 112, 103 and 101 percent respectively. Female GER for Punjab is observed at 108 percent followed by KP where it is 98 percent (Fig. 4.2, Primary).
Lower GER’s are observed for females in Balochistan (51%), FATA (54%) and Sindh (70%), as compared to other provinces/regions. For males GER’s are also comparatively lower in Balochistan (74%), GB (83%) and FATA (97%) as compared to ICT, Punjab, Sindh and KP.
GPI is defined as GER for females divided by GER for males. This index is used to indicate the level of access to education that females have, compared to the level of access that males have. For example, a GPI of more than one indicates that, in proportion to the appropriate school-age population, there are more females than males in the school system.
The GPI is highest (1.03) in ICT and the lowest (0.55) in FATA. It is higher in Punjab and GB where it is observed to be 0.96 which is even higher than the national average (0.85). Sindh and Balochistan observed a GPI of 0.68 and 0.69 respectively. The lower GPI index values in Sindh (0.68), Balochistan (0.69), FATA (0.55) and KP (0.76) show that parents here seem to be more conservative with respect to female population (Table 7.6, Primary).
Enrolment in the middle school education is 7.362 million with 4.089 (56%) million males and 3.273 (44%) million females during the year. This enrolment is up by 12.52 percent over the previous year. Based on official population of middle level a GER of 57 percent is computed for the country which is 61 percent for males and 53 percent for females. ICT observed the highest GER of 114 percent while FATA had the lowest GER of 27 percent. Punjab (65%), KP (68%) and AJK (60%) has GER’s of more than 60 percent. GER’s for other strata are below 50 percent. A similar pattern of GER ratios is observed for male and female enrolment in the provinces. It is noticed that male GER is always higher than the female GER’s indicating that relative to the appropriate school going age population, there are more male students than female students (Fig. 4.2, Middle).
At national level a GPI of 0.87 is observed at middle level. GPI of Punjab (1.00), AJK (0.93), GB (0.90) and ICT (1.04) is reasonably high while for other provinces it is below 0.76 except FATA where it is as low as 0.22 (Table 7.6, Middle).
Enrolment in the high level education is 3.861 million with 2.169 (56%) million males and 1.692 (44%) million females. On the basis of gross enrolment a GER of 46 percent is observed for high school education level with corresponding figures for males and females of 50 and 42 percent respectively showing a gender disparity of about 7 percent in favour of males. This disparity is more serious in the provincial GER figures where it is higher than 20 percent for KP and FATA. In Balochistan and Sindh it is 14 and 10 percent respectively. This disparity is minimal in Punjab, AJK, and GB where it is lower than three percent. There is no disparity observed in ICT with GER’s of 104 percent for males and females (Fig. 4.2, High).
Enrolment in the higher secondary education including TVET is 2.121 million with 1.208 million (57%) males and 0.913 million (43%) females. An overall GER of 26 percent for this level with 29 and 23 percent for males and females observed respectively. Across the provinces GER ranged from 20 percent in Balochistan to 84 percent in ICT. An overall GPI of 0.81 is observed for the country at combined TVET and higher secondary level which ranges from 0.30 in FATA to 1.32 for ICT. Punjab, GB and ICT had more than one GPI while Sindh, KP and Balochistan observed more than 0.60 while it is 0.55 in AJK. In GB and Punjab a major shift in ranks is observed from rank eight to four and from rank six to three in favour of female enrolment while in FATA and Sindh it is reversed (Fig. 4.2, Higher Secondary).
In order to get a complete picture of enrolment from primary to higher secondary level education (Classes 1-12) the data is combined. A total of 36.276 million admissions were granted in the country during the academic session 2017-18 with 20.305 million (56%) male and 15.971 million (44%) female students. At the national level GER of 70 percent was observed with gender distinction of 75 and 64 percent for males and females respectively. In the provinces/regions the highest GER was observed for ICT (127%) while it was lowest in Balochistan (42%). Gender-wise lowest was observed for males in Balochistan (50%) and for females in FATA (29%). ICT observed higher GER’s for both sexes with 124 and 131 percent for males and females respectively. The disparity in GER for gender was found the highest (35%) in FATA followed by KP (27%), Sindh (20%), Balochistan (17%) and AJK (7%). It was only two to three percent in Punjab, GB and ICT. It seems that there is need to boost up females admissions in Sindh, KP, Balochistan and FATA by campaigning for female education through electronic and print media in order to minimize the gap in male and female enrolment (Fig. 4.2, Primary to Higher Secondary). GPI at national level for primary to higher secondary was observed at 0.85 with minor fluctuations in the provinces/regions. It was the highest in ICT (1.06) and the lowest in FATA (0.45).
4.1.3 Adjusted Net Enrolment Ratio (ANER)
In Pakistan education system with respect to age of the students is divided into four age groups from Primary to Higher Secondary School. These are:
Primary Schools (Grade I-V) Age \(05-09^{+}\) Years
Middle Schools (Grade VI-VIII) Age \(10-12^{+}\) Years
Secondary Schools (Grade IX-X) Age \(13-14^{+}\) Years
Higher Secondary Schools/Inter Colleges (Grade XI-XII) Age \(15-16^{+}\) Years
However in normal practice the enrolment is allowed to students in these categories even if they do not strictly follow the limits of the age groups. Therefore a survey was conducted by a team of AEPAM under NEMIS to collect age specific data in sampled schools all over the country to provide basis for adjustment. The ANER’s discussed below are thus computed using the age specific percentages reported by NEMIS survey.
Adjusted Net Enrolment in primary education was 16.534 million with 9.277 million (56%) males and 7.257 million (44%) females. The national ANER at primary level was reduced to 73 percent as against 102 percent GER for the year 2017-18. This was down by three percent over the previous year. Consequently ratios of ANER for males (79%) and females (67%) were computed as against GER’s of 110 and 93 percent for males and females respectively. There is no shift in ranks for GER and ANER except for AJK and FATA where ranks of 6 and 7 were exchanged to 7 and 6 respectively. It may also be noticed that higher percentages of adjustment were observed for Punjab and ICT (34, 62 percent) while it was lowest for FATA (12%) (Fig. 4.3, Primary). GPI of ANER at primary level was computed as 0.84 with the lowest of 0.57 for FATA showing gender disparity and the highest 1.01 for ICT showing gender parity.
Adjusted net enrolment in middle education was 9.270 million with 5.165 million (56%) males and 4.105 million (44%) females. Adjusted net enrolment ratio (ANER) of 72 percent was observed for the country in the Middle level. This ratio was 77 percent for males and 66 percent for females showing about 11 percent more enrolment for males. This shows that about 15 percent students in this level were either below or above the officially declared age group of middle level education and for males and females this disparity was 16 and 6 percent respectively (Fig. 4.3, Middle).
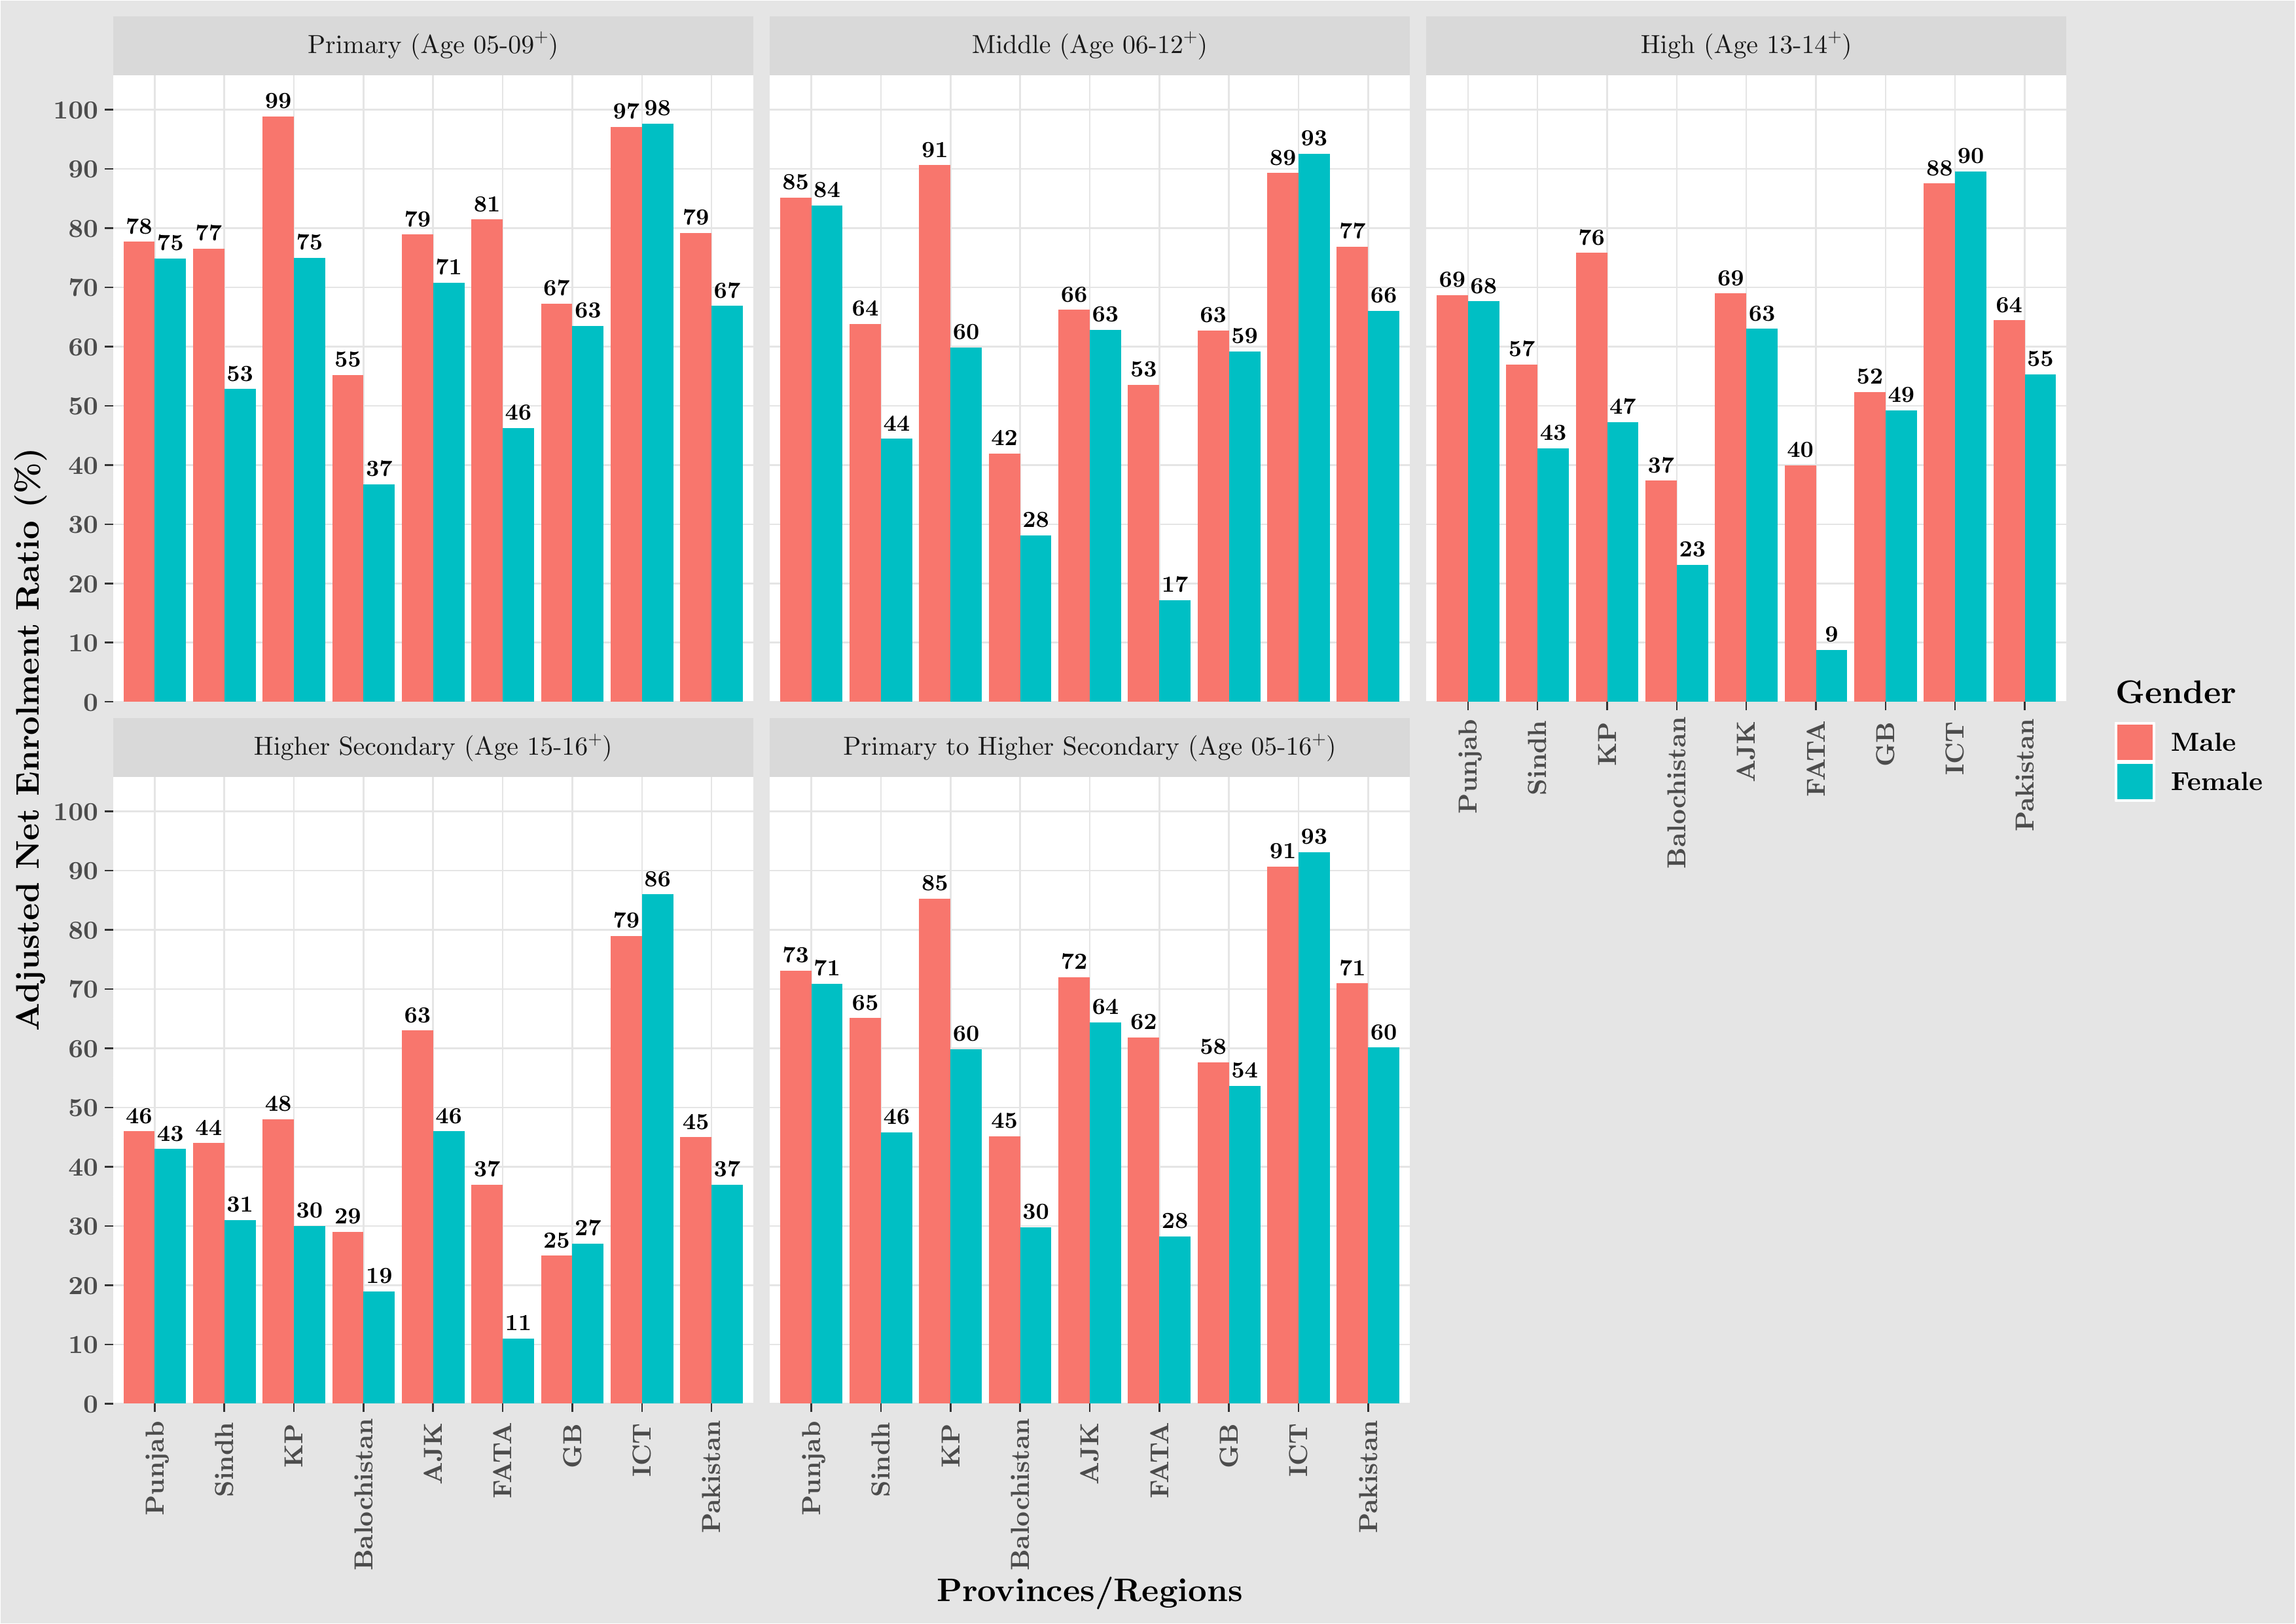
Figure 4.3: ANER by Gender and Education levels for Provinces/Regions of Pakistan 2017-18
ANER for middle level education was up from 57 percent GER to 72 percent. ANER was about 15 percent upwardly adjusted at middle level school education for under age and over age students admitted at this level. The highest adjustment was required in Punjab where it was 20 percent while the lower differences were observed in Balochistan and FATA where it was seven to nine percent which shows that admissions are strictly done in the officially declared age groups for the students in the province/region. GPI indices also showed minor adjustments from GER to ANER. For Pakistan ANER, GPI was 0.86 as compared to GER, GPI of 0.87. GPI of ANER was adjusted downward for Punjab and Sindh while it was adjusted upward for other strata but remained same for ICT.
Adjusted net enrolment at high level was 4.997 million with 2.787 million (56%) males and 2.210 million (44%) females. ANER of 60 percent was observed for the country at secondary level. This ratio was 64 percent for males and 55 percent for females showing about nine percent more enrolment for males at national level. This shows that about 14 percent students in this level were either below or above the officially declared age group of secondary level education and for males and females this disparity was 14 and 13 percent respectively. The GPI for this level was observed as 0.86 which is better by two percentage points after adjustment. In the gender parity index some minor rank shuffling as well as index adjustment was observed across the provinces which does not seem to be critical. Punjab and ICT showed gender parity while in all other provinces/regions there was gender disparity of medium to high level, with FATA showing a very low GPI value of 0.22 (Fig. 4.3, High).
Adjusted net enrolment at higher secondary level including TVET was 3.324 million with 1.894 million (57%) males and 1.430 million (43%) females. ANER for the higher secondary level education and TVET combined followed similar pattern as observed in middle and secondary level school education and it was up from 27 percent GER to 41 percent ANER with a 14 percent increase due to adjustment factor. Higher percentages of more than 14 percent were acquired for Punjab, KP and ICT while it were eight percent for Sindh and AJK, and two, three and four percent for GB, FATA and Balochistan. GPI of GER as well as ANER was observed as 0.81. GPI indices across the provinces for this education level observed changes in GB and ICT where these figures were greater than one showing parity in favour females, while for other provinces GPI values were from a low value of 0.30 to a high of 0.93 for FATA and Punjab respectively.
Adjusted net enrolment (Class 1-12) was 34.125 million out of which 19.123 million (56%) were males and 15.002 million (44%) females. ANER at national level (primary to higher secondary) was lowered from GER by four percent and it stood at 66 percent after adjustment for official age (Age \(05-16^{+}\)). Maximum adjustment was needed in ICT where it was reduced by eight percent with only one and three percent adjustment required in FATA and Sindh. All other provinces/regions had four percent reduction from GER to ANER (Fig. 4.3). GPI of 0.85 was observed for ANER at the national level and it varied from a low of 0.46 in FATA to a high of 1.03 for ICT. For ANER the GPI index remained the same for all the provinces/regions with one percent reduction in AJK, FATA, and GB. GPI for ICT was reduced to 1.03 from 1.06 showing parity in favour of females.
4.1.4 Out of School Children
NEMIS gives a complete picture of net enrolment and out-of-school children for all provinces and federating units in both the public sector (formal and non-formal) and private sector.
The current population census was conducted in 2017, however, age-wise population figures are not yet published. As a result, all demographic calculations for subsequent years must use population projections based on the 1998 census. For the purpose of this report, projections of National Institute of Population Studies (NIPS) based on 1998 population census for the year 2017 have been used. For the enrolment, adjusted net enrolment figures have been taken. According to NIPS projections, there are currently 51.933 million children in Pakistan between the ages of 5 and 16 years. Among this group, only 34.125 million (66%) children are attending schools from primary upto higher secondary in both public and private sectors, leaving 17.808 million children (34%) out of school. This is a significant reduction (22%) over the previous year, when there were 22.844 million OOSC.
There are currently 6.039 million children of primary-school age out of school. At the middle, high and higher secondary level, the out of school children are 3.665 million, 3.327 million and 4.755 million respectively (Fig. 4.4).
If we observe gender-wise out of school children more females are out of school than males. In Primary to Higher Secondary Level, 40 percent of population of female children are out of school as compared to 29 percent of the male population. Out of total OOSC from primary to higher secondary there are 44 percent males and 56 percent females.
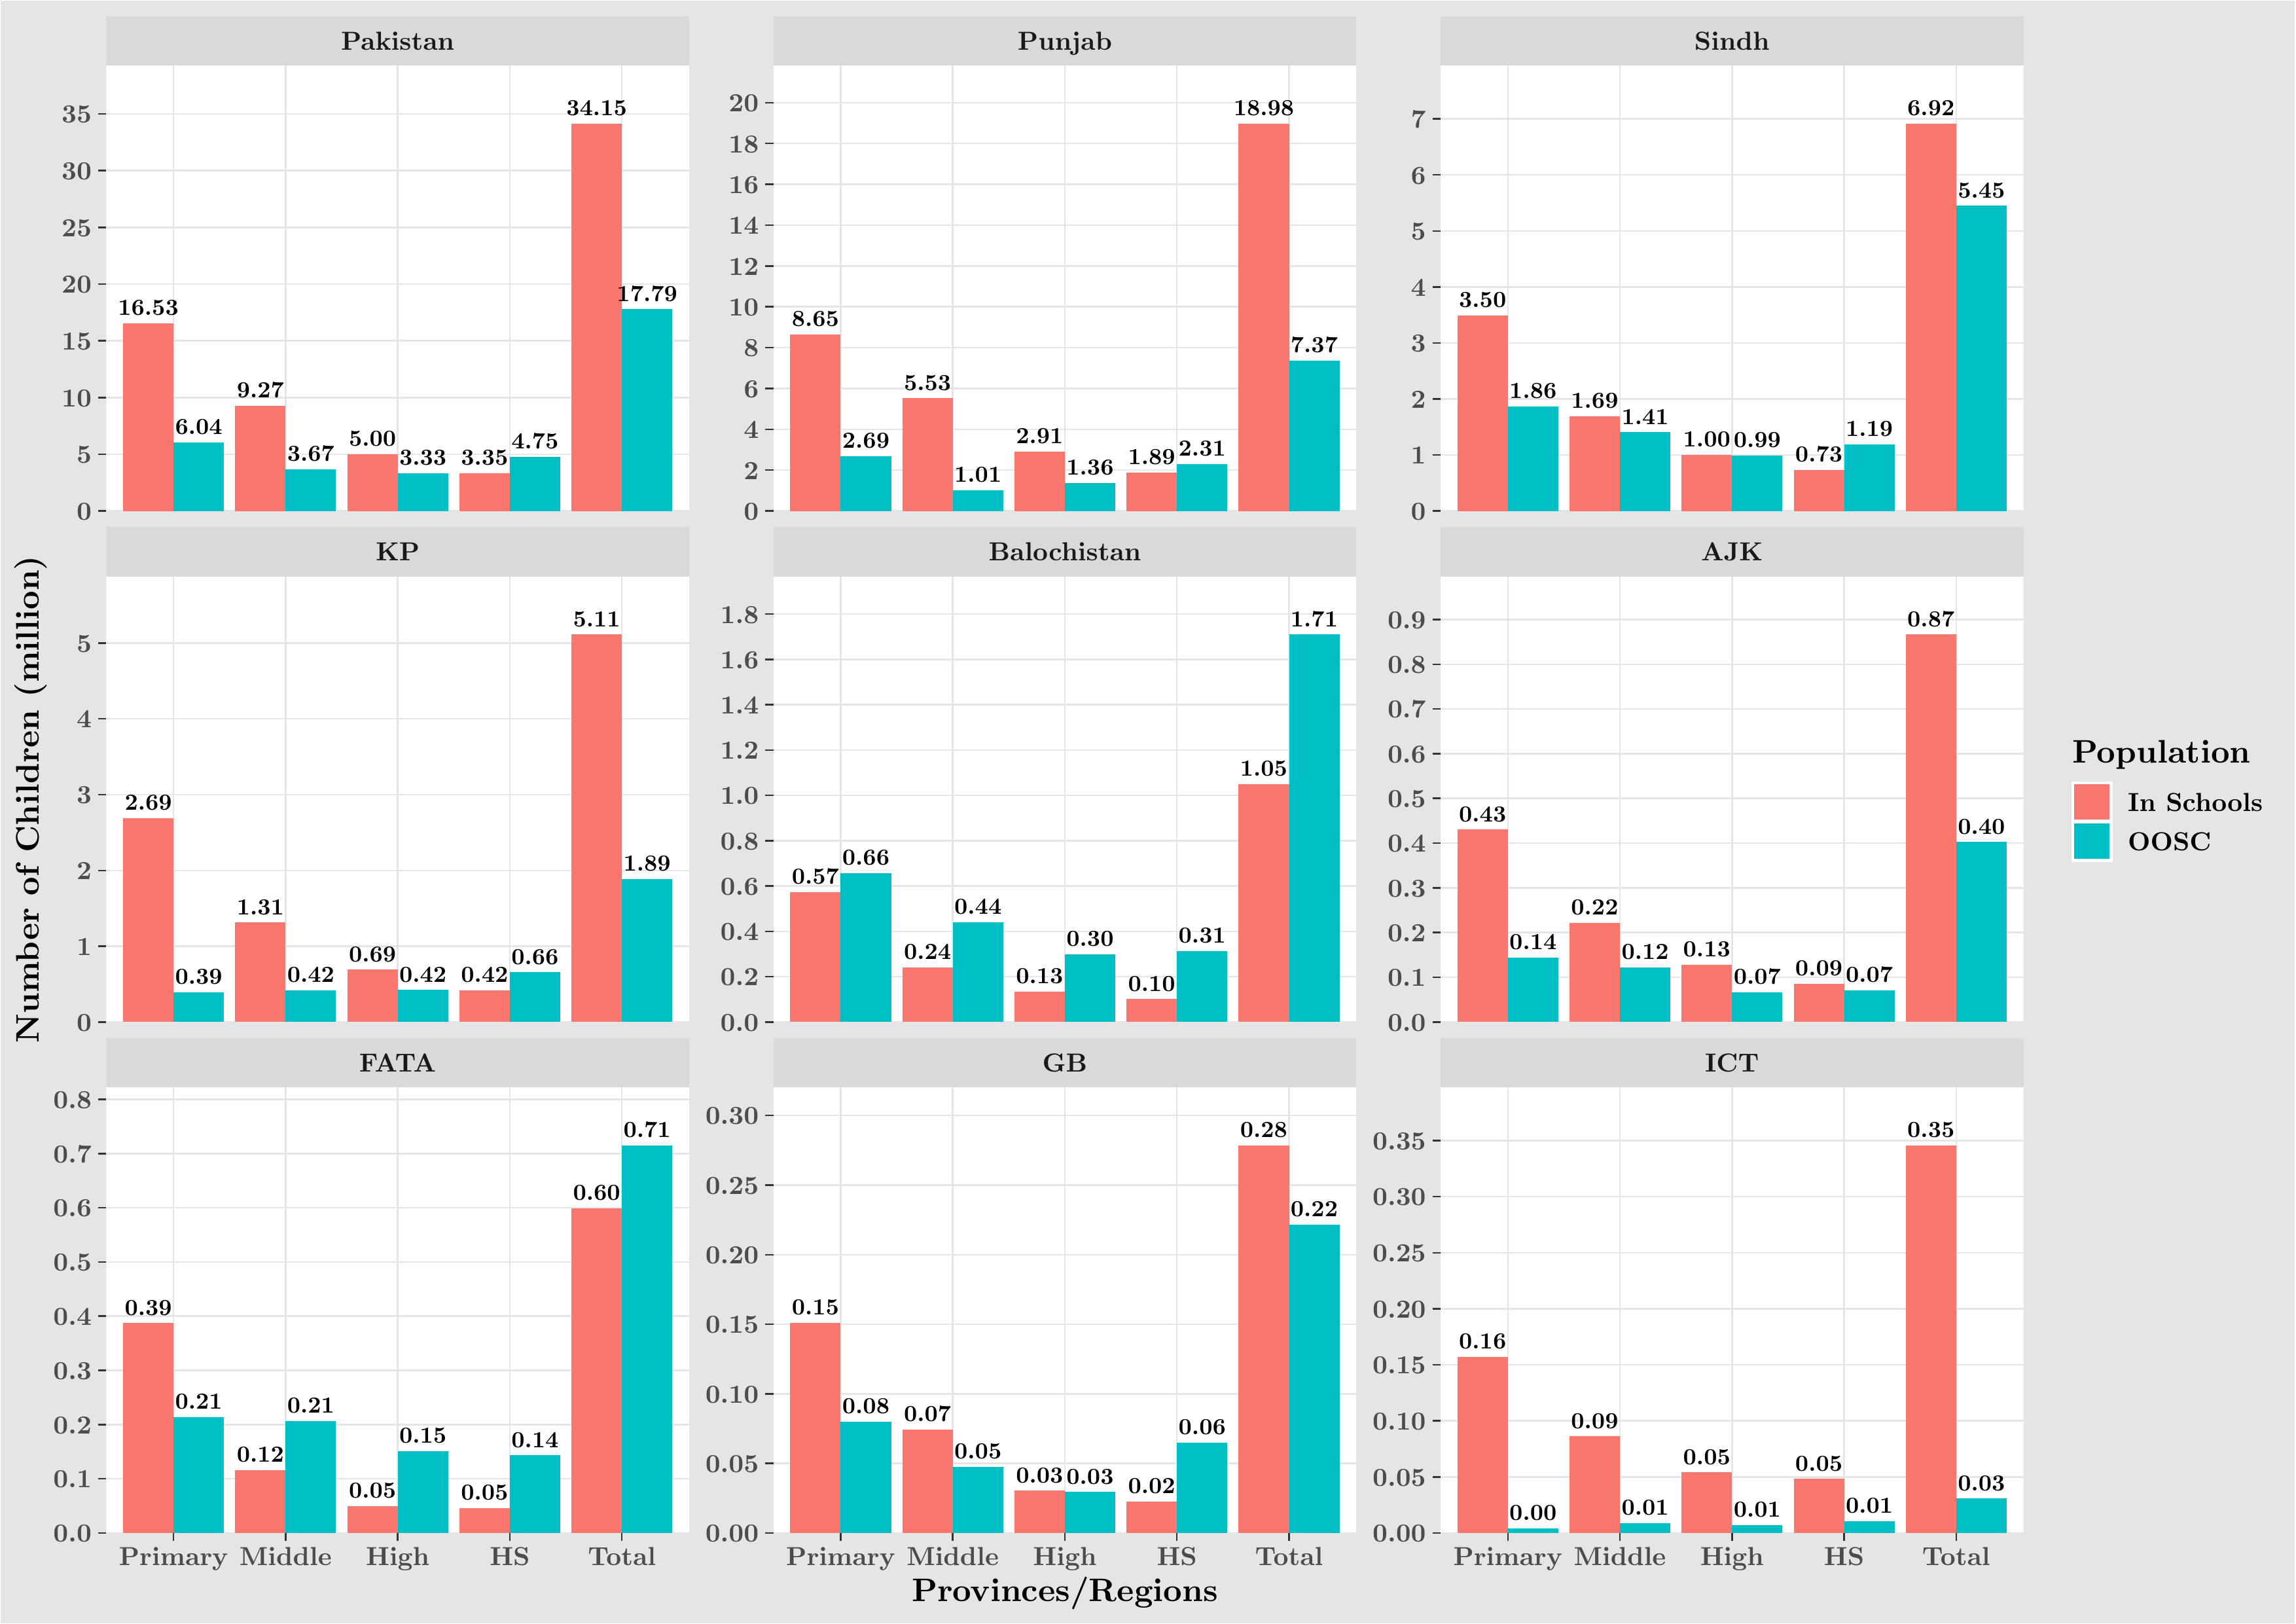
Figure 4.4: Number of In School and Out of School Children by Education levels for Provinces/Regions of Pakistan 2017-18
Out of school children is a big issue which challenges the government about their responsibility to provide compulsory basic education to each and every child in the country (age \(05-16^{+}\) years) which is mandatory under the constitution. There are alarming figures that show that this basic right is not fulfilled for every child of the country. Distribution of OOSC by gender and eduction level is given in Fig. 4.5. A total of 6.039 million children (34%) are estimated to be out of schools in the primary age group (\(05-09^{+}\) years) of which 2.437 (40 percent) are males and 3.601 (60%) are females. This is almost 26.75 percent of the total population of this age group meaning that every one out of four children in this age group is out of school due to one reason or other. In KP, FATA, Sindh much more females are OOSC as compared to males. In Punjab and GB the difference is quite small. In ICT more males are OOSC as compared to females. There was an increase of 19.32 percent in OOSC at primary level of education in Pakistan over the previous year. Except from ICT and KP where there is decrease in OOSC over the previous year, all the other provinces observed an increase in the number of OOSC in the primary education. The percentage of OOSC across the provinces varied from (19, 54) in FATA to (33, 37) in GB for males and females respectively. In Punjab and AJK it is (22, 25) while in Balochistan and Sindh percentages of (45, 63) and (23, 47) are observed for males and females respectively (Fig. 4.6).
OOSC in the middle level school education group also had 3.665 million children with 1.553 (42%) and 2.111 (58%) million males and females respectively. This is 28.33 percent of the total population at this age level showing even worse situation than observed at primary level. This number shows a reduction of 43.74 percent at this level of schooling over the previous year which is a good news. This reduction was observed for all provinces with varying percentages.
OOSC in the high school education group showed 3.327 million children with 1.539 (46.25%) males and 1.788 (53.75%) females. This is 39.97 percent of total population of this age group who are OOSC. This number shows a reduction of 33.85 percent at this level of schooling. This reduction was observed for all provinces with varying percentages.
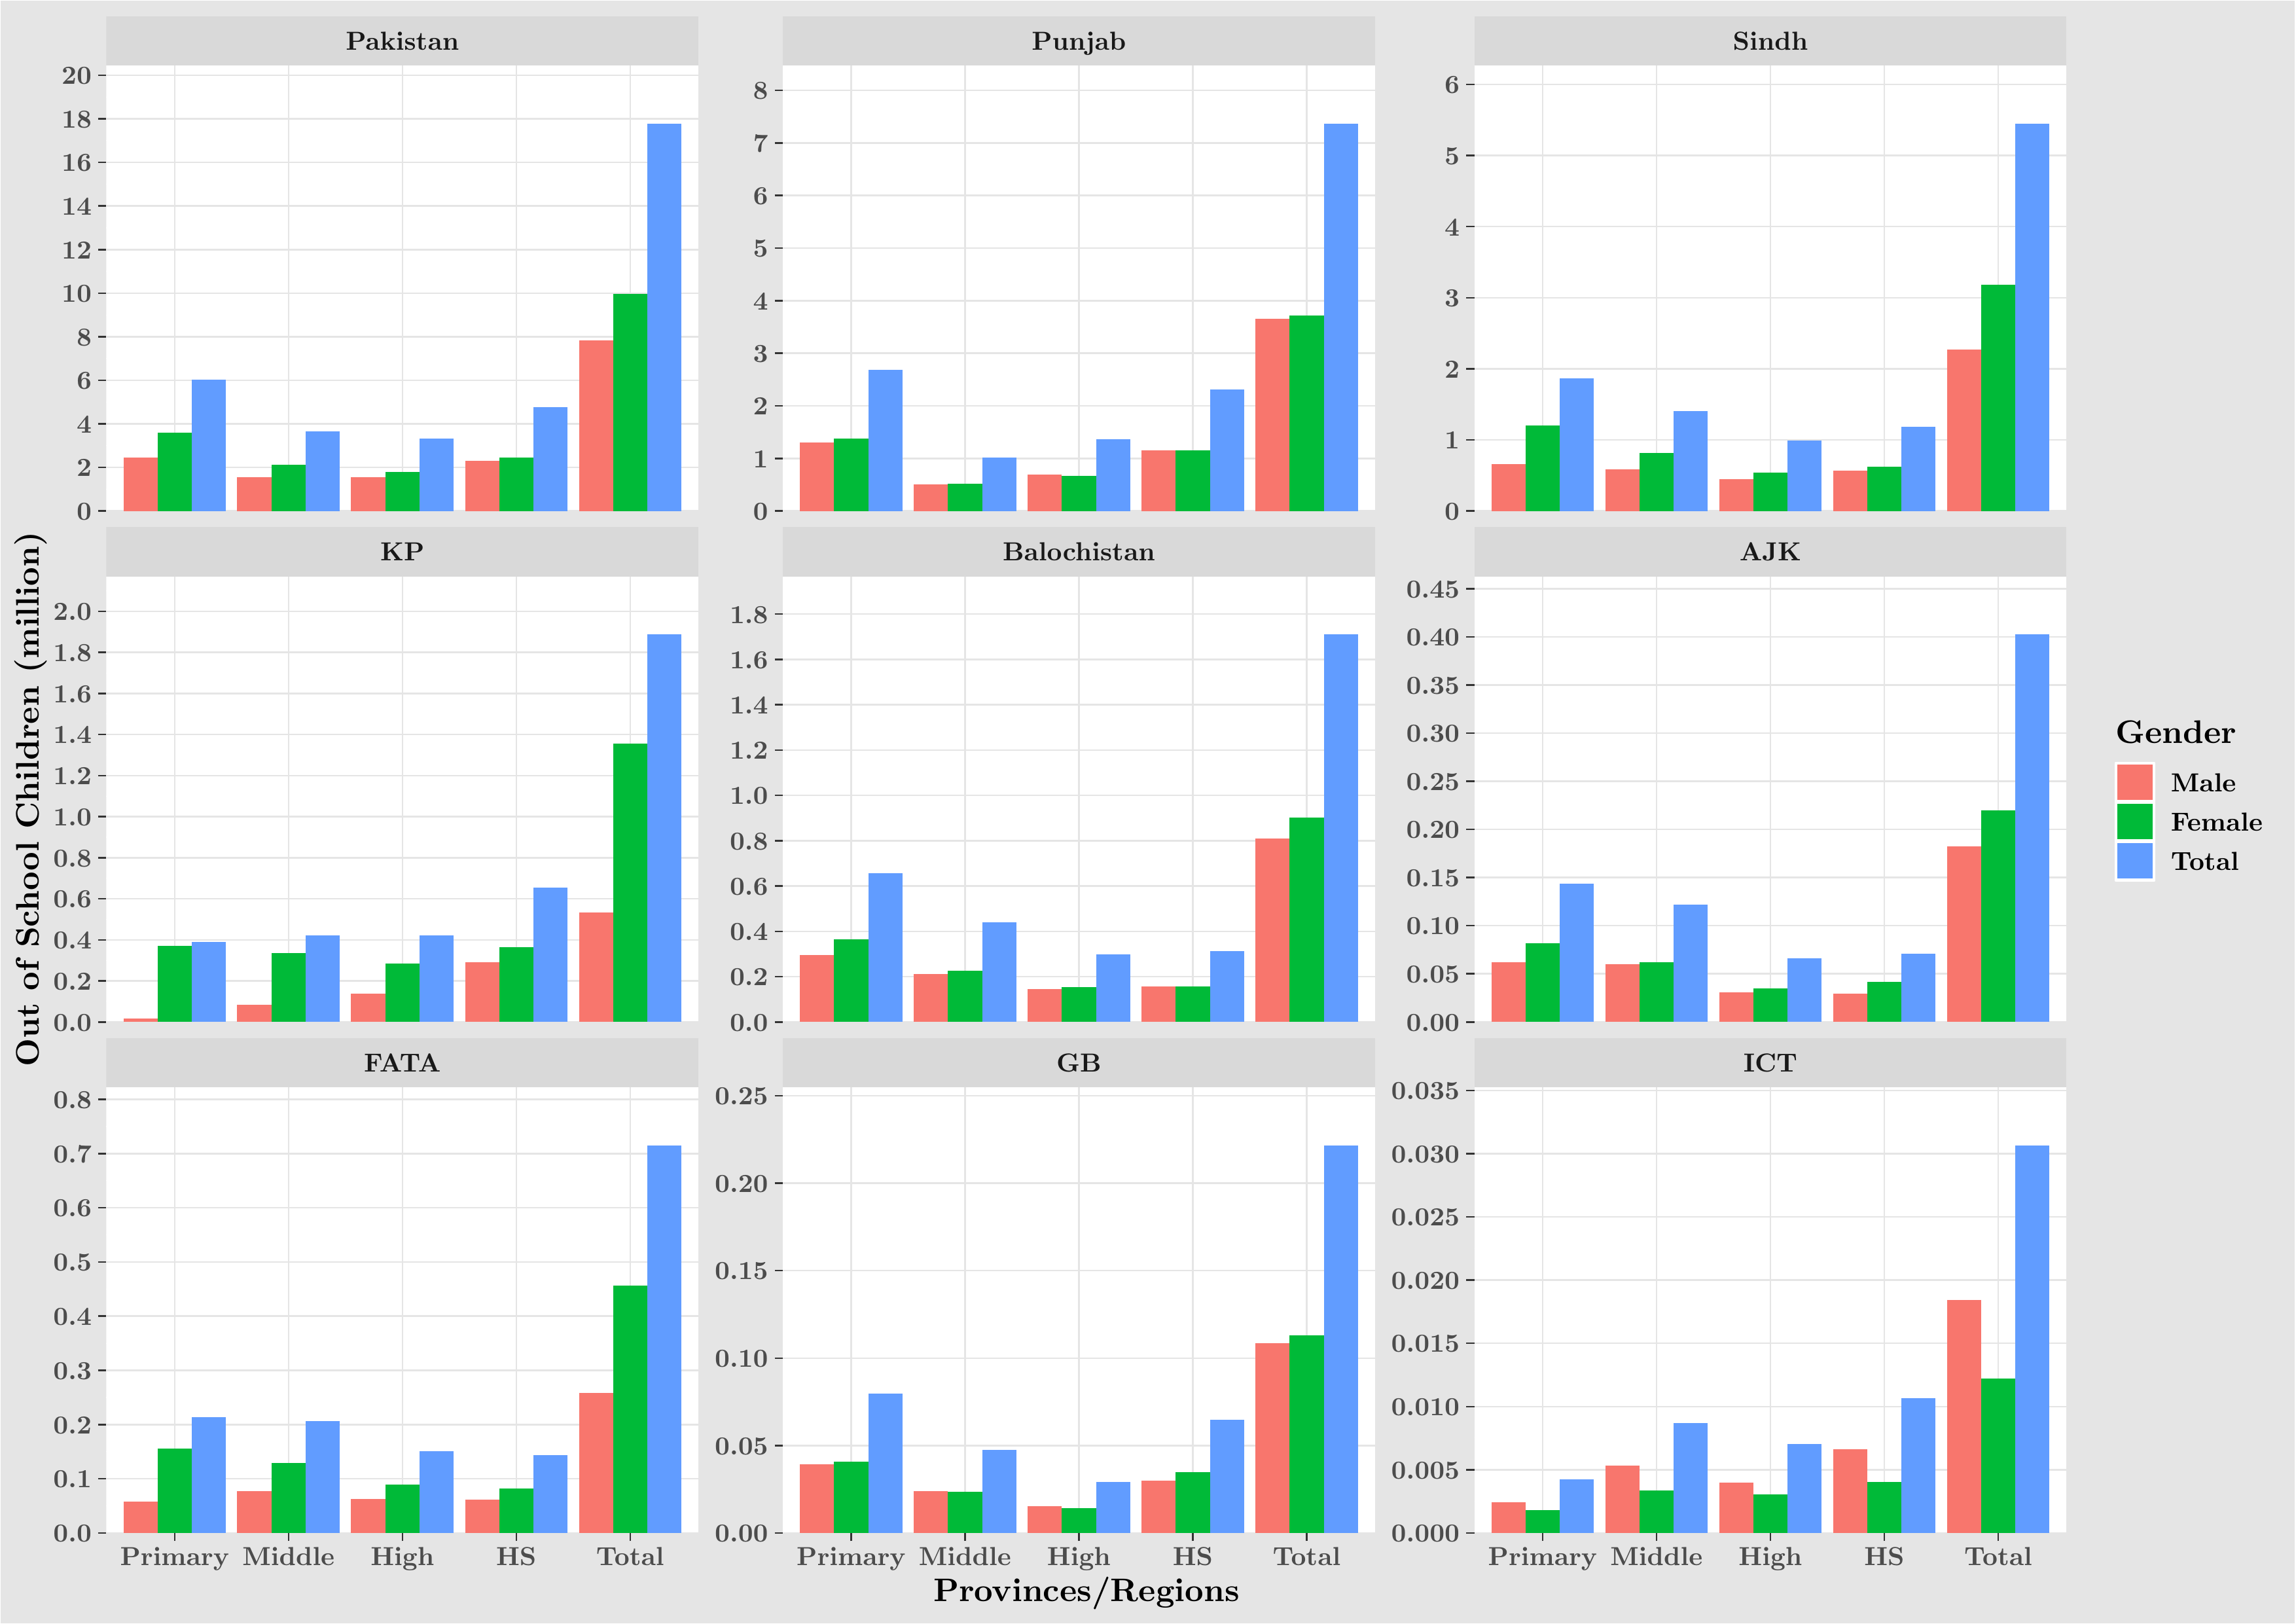
Figure 4.5: Distribution of OOSC by Gender and Education levels for Provinces/Regions of Pakistan 2017-18
OOSC in the higher secondary level and TVET institutions combined showed 4.777 million children with 2.310 million (48%) males and 2.467 million (52%) females. Since there are a total of 8.101 million children in this age group which shows that 59 percent of them are not going to school. However compared with the previous year there is a reduction of 25 percent OOSC at this level of schooling and technical/skill development education. This reduction was observed for all provinces with varying percentages.
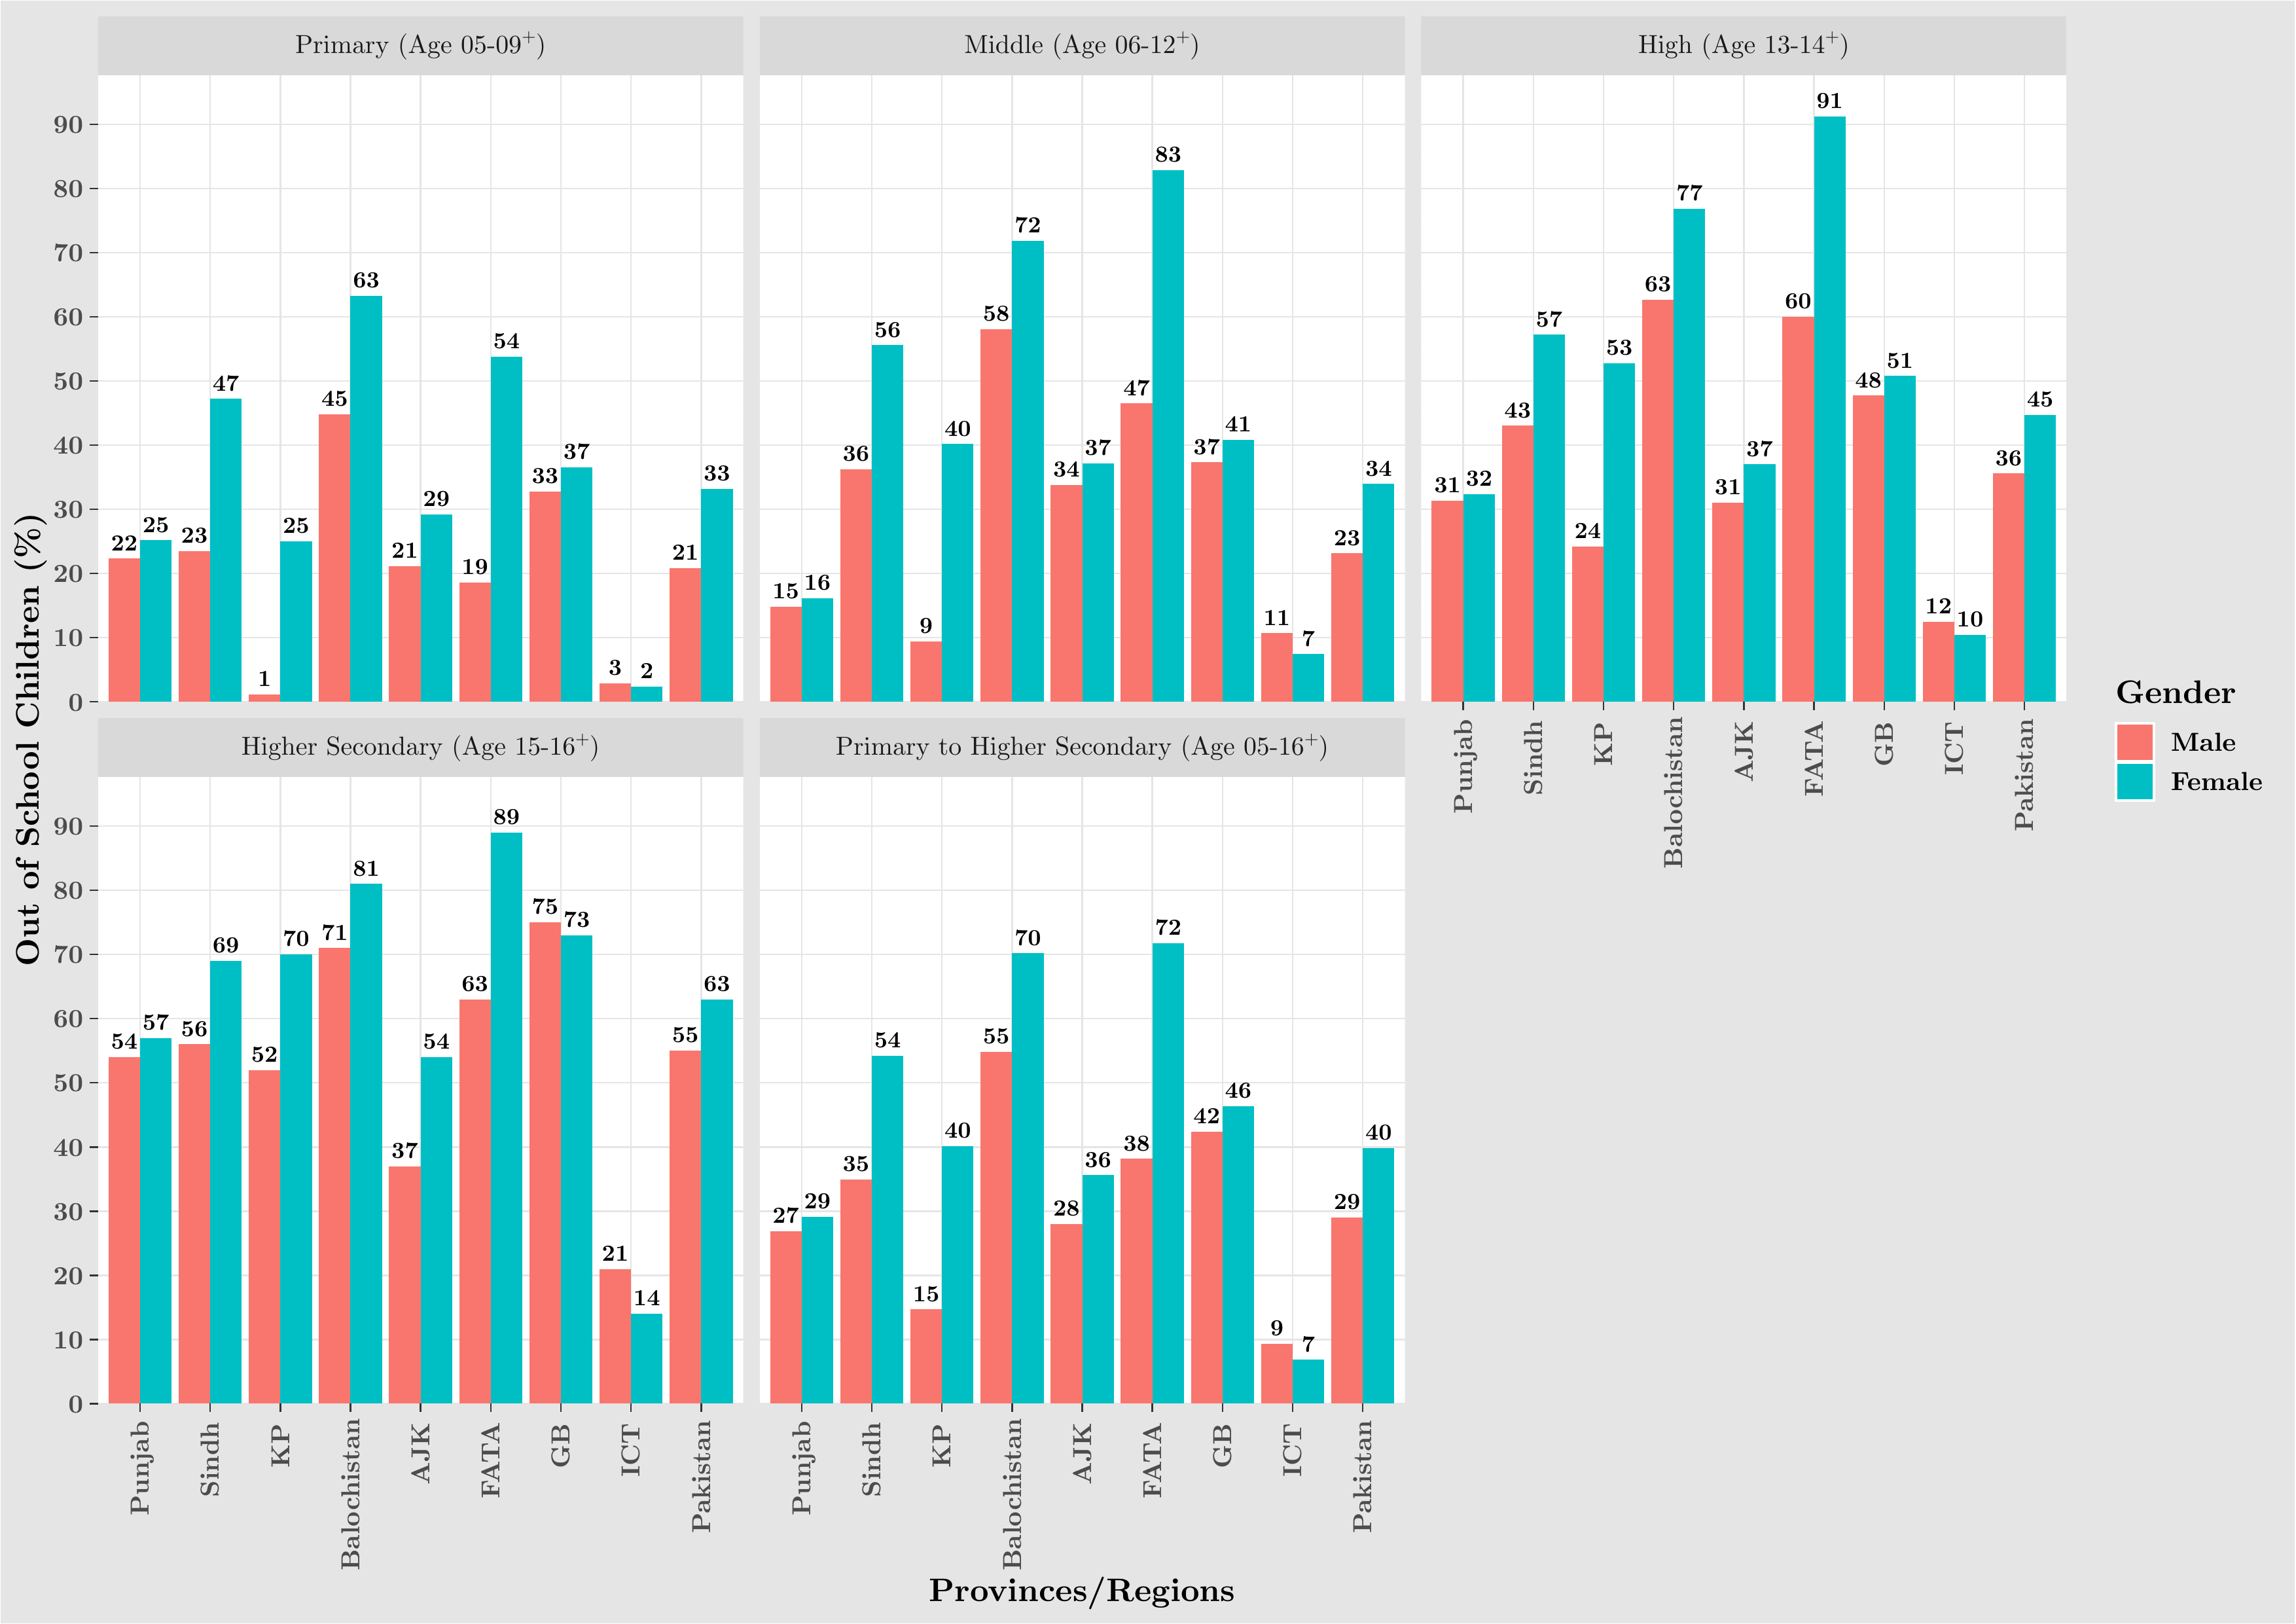
Figure 4.6: Percentage distribution of OOSC by Gender and Education levels for Provinces/Regions of Pakistan 2017-18
For all classes in the age group (\(05-16^{+}\) years) there were 17.808 million OOSC of which 7.840 million (44%) were males and 9.968 million (56%) were females showing about 12 percent more females OOSC as compared to males. This shows that about 33.86 percent OOSC which means that one out of every three child does not attend school during the school going age (\(05-16^{+}\) years). Despite Government efforts the situation still needs much attention from the education departments to work for reducing the number of OOSC in females. This gap between male and female has widened over the previous year when it was about seven percent. There is need to make this gap closer by providing incentives for female education. It may be appropriate to describe that over the previous four academic years 2013-17 the OOSC figures remained almost stagnant 24.816, 24.024, 22.634 and 22.844 million showing (-3, -6 and 1) percent change over the corresponding previous year. In 2017-18 a decrease of 22.14 percent was observed when the OOSC figure dropped to 17.808 million children from 2016-17.
The percentage distribution of OOSC by gender, education level and provinces/regions of Pakistan is given in Fig. 4.6. It is observed that at the national level from primary to higher secondary level there is a gap of about 11 percent showing more females (40%) are OOSC as compared to males (29%). This gap is quite small in Punjab, GB, AJK and ICT, while it is quite large in FATA, KP, Sindh, and Balochistan. Similar pattern with varying percentages is also visible at different stages of education. Major reason for this disparity is due to the cultural barriers in the society which can only be removed through better awareness through media and other means of communication and concerted efforts by the provincial/regional governments.
4.1.5 Effective Transition Rate
4.1.5.1 Effective Transition Rate (ETR) between Primary to Middle Level
An ETR of 83 percent was observed for Pakistan for Primary to Middle which was lower by about one percent over the previous academic year (Table 5.2). Gender parity was almost one showing equal transition for males and females from primary to middle education. Effective Transition rate for females was lower in Sindh (67%) and FATA (63%) and higher in Punjab (87%) and GB (87%). For males ETR was almost hundred percent for FATA (100%) and ICT (98%) while it was above 80 percent for all other provinces/regions except Sindh where it was 73 percent. GPI for ETR from primary to middle was almost one at National level as well as for KP and Balochistan. It was a bit more than one in Punjab (1.02), GB (1.04) and ICT (1.02) showing gender parity and the lowest (0.63) in FATA showing gender disparity (Fig. 4.7).
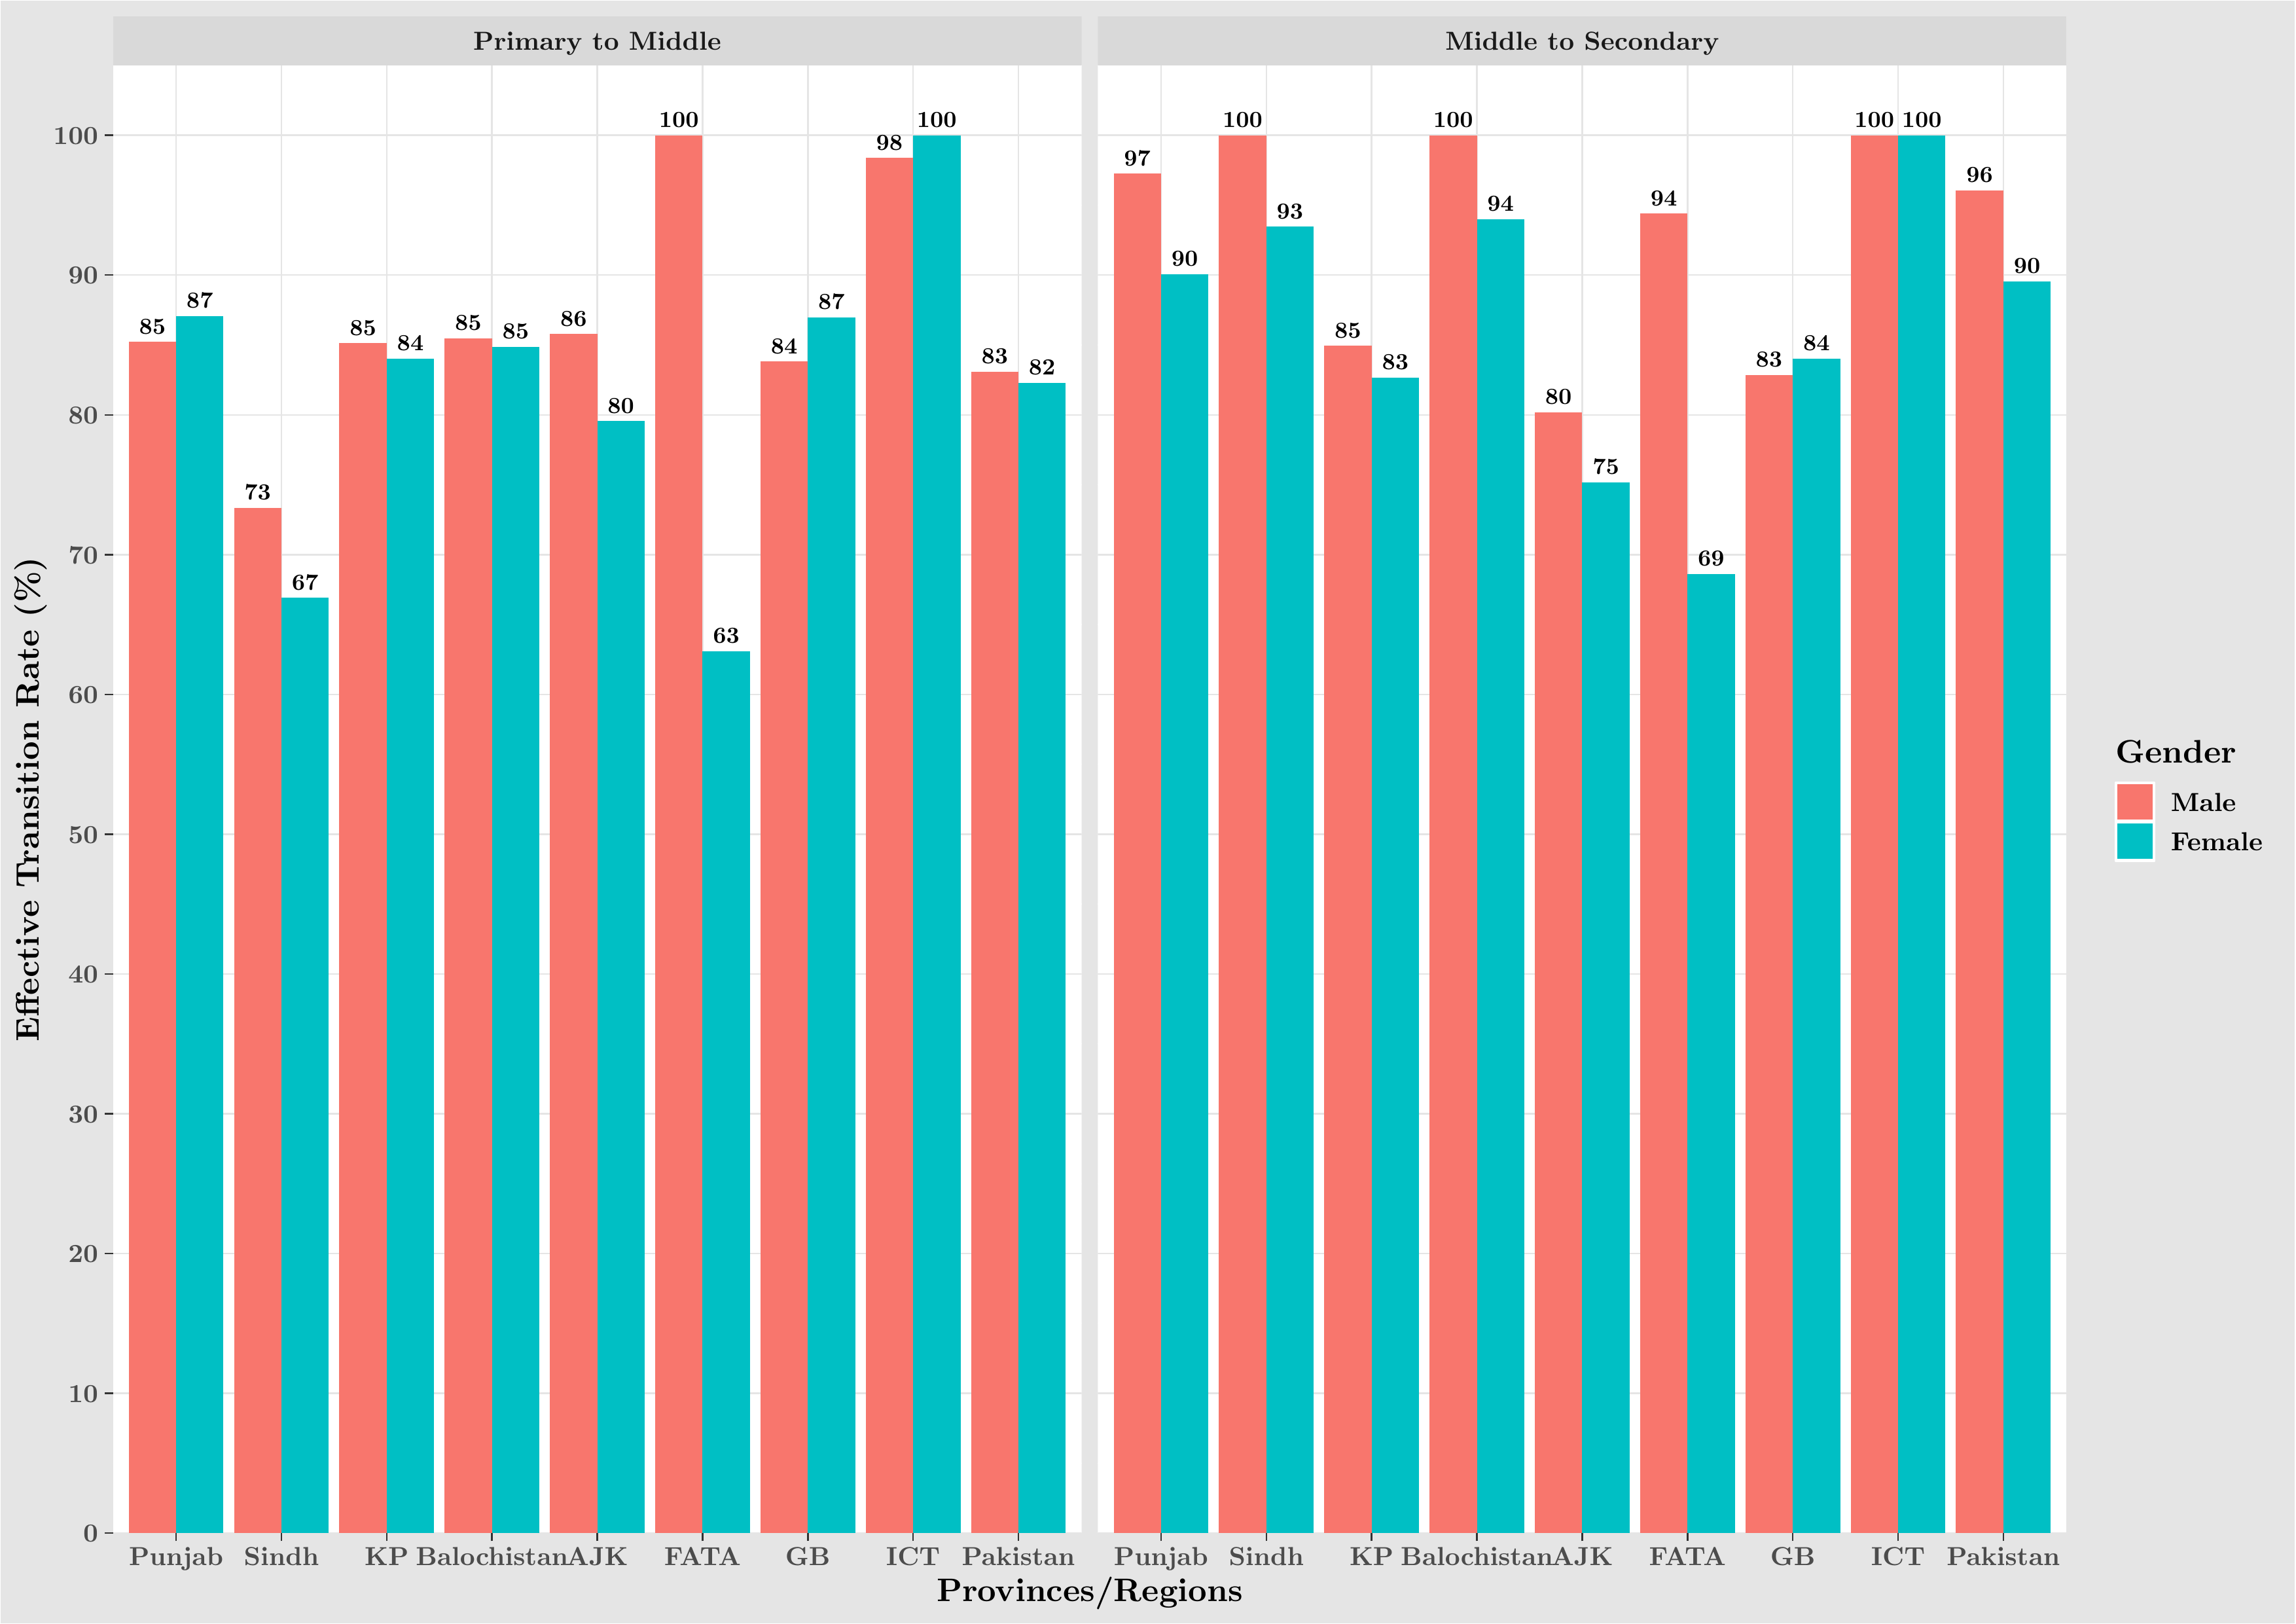
Figure 4.7: ETR by Gender and Education levels for Provinces/Regions of Pakistan 2017-18
4.1.5.2 Effective Transition Rate (ETR) from Middle to Secondary Level
An ETR of 93 percent was observed at National level which was higher by two percent from the previous year (Table 5.2). It was six percent higher for males (96%) as compare to females (90%). ETR for males and females in different proviences/regions show gender disparities. It was mostly higher for males as compared to females except for GB where it was 83% for males and 1% higher for females. In ICT, ETR was 100% for both males and females (Fig. 4.7).
GPI of one was observed for GB (1.01) and ICT (1.00) showing gender parity of ETR while for all other Provinces/Regions GPI’s for ETR were observed from 0.93 to 0.97 except for GB where it was 0.73.
4.2 Equity in Education
4.2.1 Gender Parity Index (GPI) for Gross Enrolment Ratios
GPI’s for different stages of school education for Pakistan and Provinces/Regions are portrayed in Fig. 4.8. The gender differences in gross enrolment ratio in primary level of education shows a GPI of 0.85 for Pakistan. For ICT a GPI of 1.03 is observed while for Punjab (0.96), AJK (0.91), and GB (0.96) which signifies fairly equal proportions of males and females. Sindh (0.68), KP (0.76), Balochistan (0.69) and FATA (0.55) show comparatively low values of GPI for GER in primary education which is due to the socio-cultural constraints prevailing in these societies.
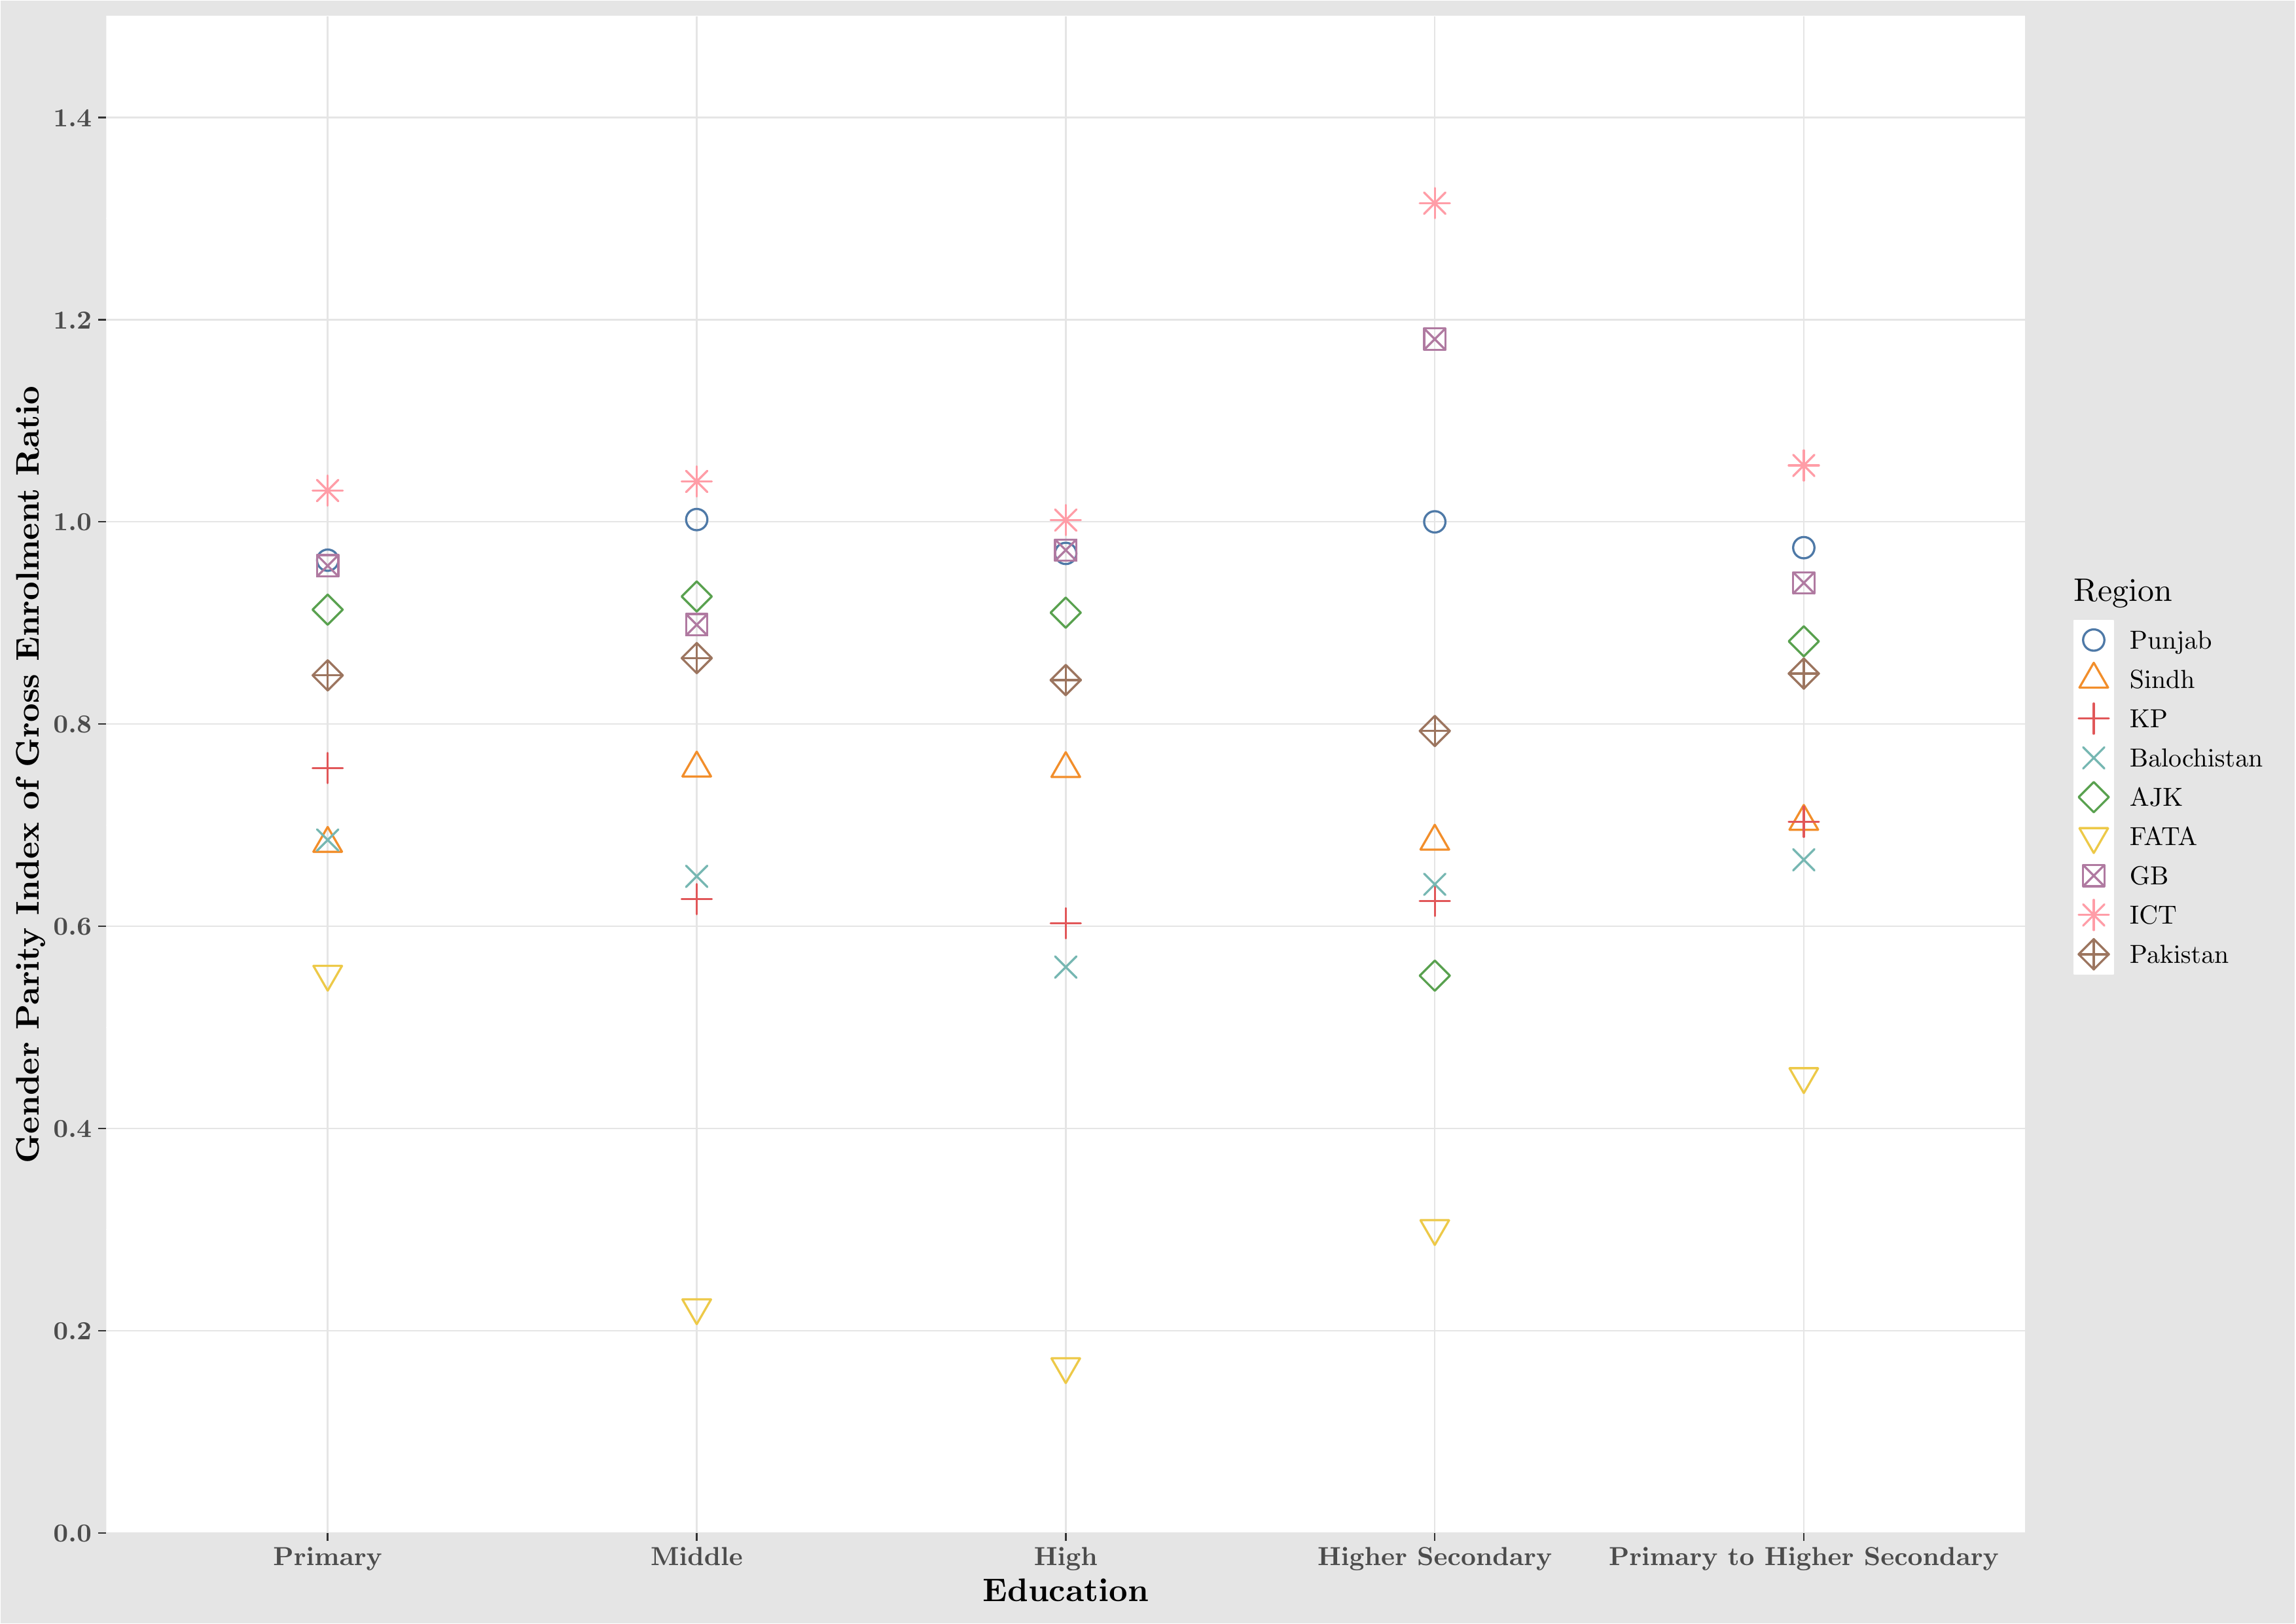
Figure 4.8: General Parity Index of Gross Enrolment Ratio by Education levels for Provinces/Regions of Pakistan 2017-18
Gender parity in favour of females for GER were observed for Punjab, ICT, and GB, for all other provinces/regions the value was less than one. More variability in the GPI’s were found at higher secondary level. FATA had the lowest GPI’s for all levels of education.
4.2.2 Gender Parity Index (GPI) for Adjusted Net Enrolment Ratios
GPI’s based on ANER for different levels of education and provinces/regions are portrayed in Fig. 4.9. It is again observed that at all levels FATA had the lowest GPI. Only ICT has GPI values of more than one showing gender parity in favour of females while for Punjab the values were quite close to one showing parity. Parities were below 0.80 for KP, Sindh, and Balochistan and above this value for AJK, and GB.
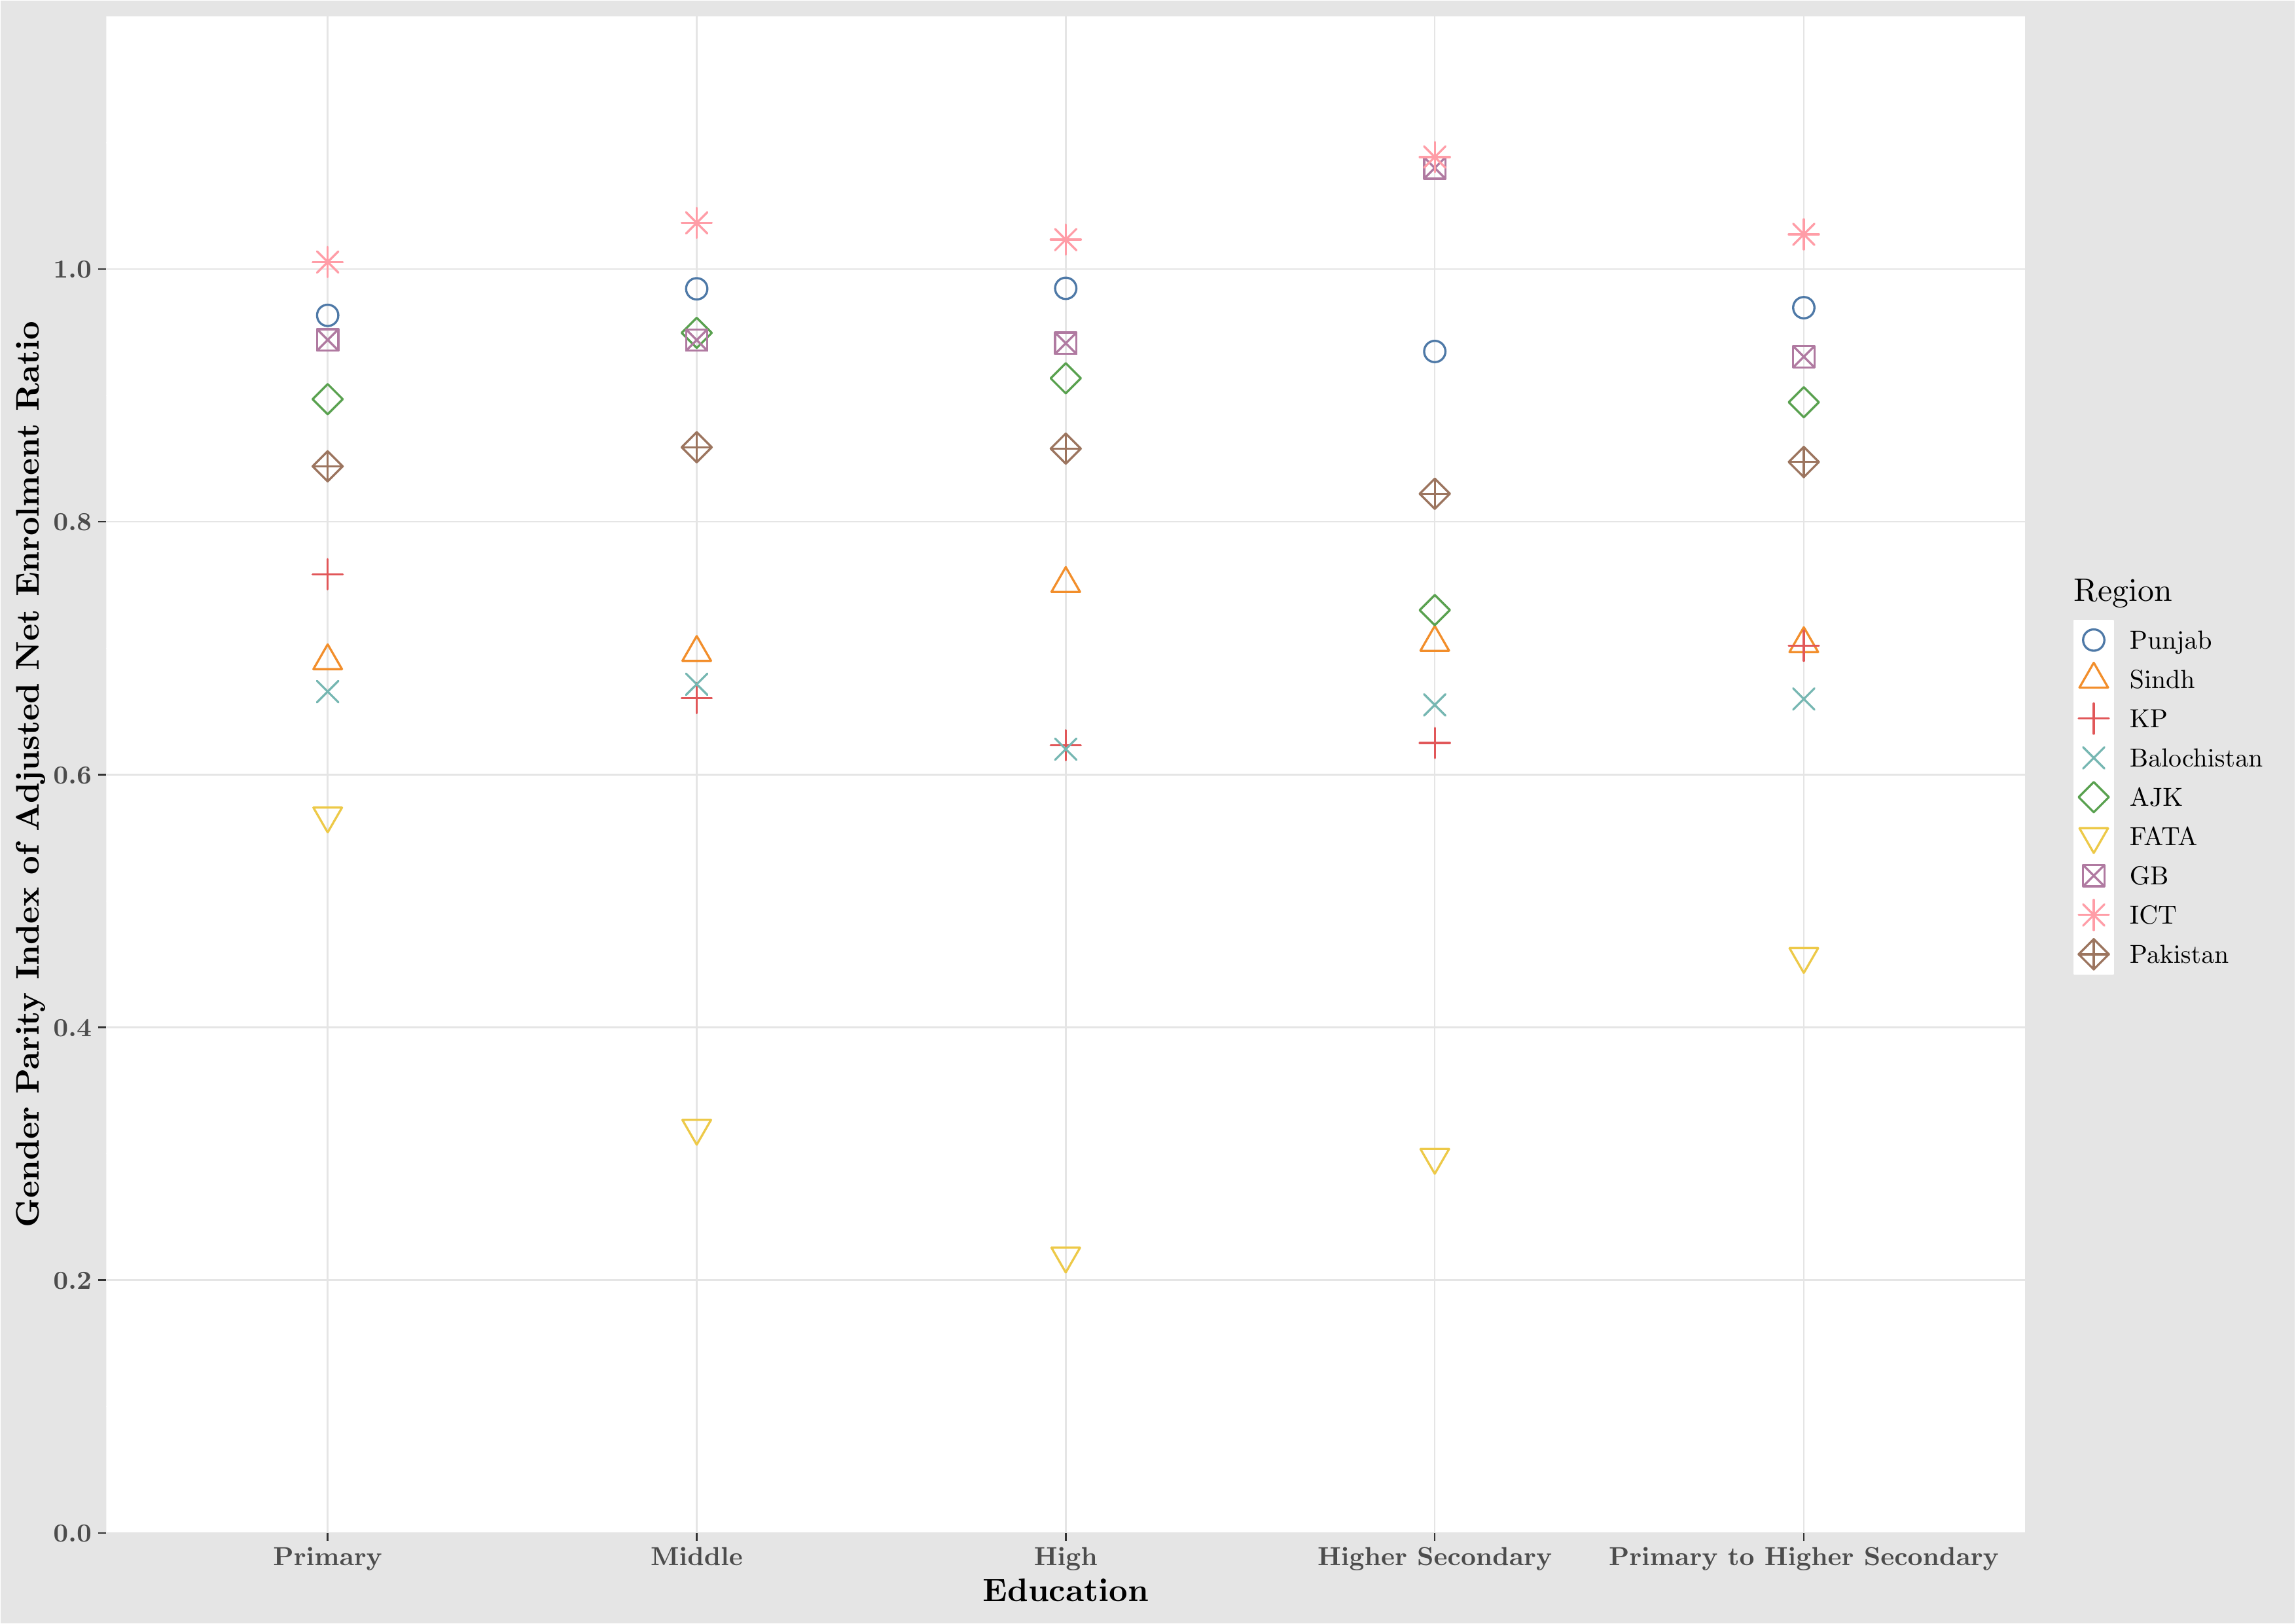
Figure 4.9: General Parity Index of Adjusted Net Enrolment Ratio by Education levels for Provinces/Regions of Pakistan 2017-18
GPI for Enrolment Ratios in middle, secondary and higher secondary level of education show a similar pattern as observed in primary education but the values of FATA is further reduced to more than half of those observed at primary level.
4.3 Quality in Education
4.3.1 Survival Rate (SR) to Grade V, VIII and X
Survival Rate also called Retention Rate, is the proportion of a cohort of pupils who reached Grade-V expressed as a percentage of pupils enrolled in the first grade of a given cycle in a given school year.
A Survival Rate approaching 100 percent indicates a high level of retention and low dropout incidence. Survival Rate may vary from grade to grade, giving indications of grades with relatively more or less dropouts. The distinction between survival rate with and without repetition is necessary to compare the extent of wastage due to dropout and repetition. Survival rates reported here are based on without repetition.
An overall survival rate of 63 percent to Grade-V in primary education was observed which was 67 and 59 percent for males and females respectively. In the provinces it was lower for Sindh (57%) and higher in Punjab (67%). In the regions a lowest value of 42 percent was observed for FATA with gender discrepancy of 56 and 21 percent for males and females respectively. In AJK and GB it was more than 70 percent while in ICT it was observed to be hundred percent for both sexes. The national GPI of survival to Grade-V was observed at 0.87 with highest in Punjab (1.04) favouring female students while it was lowest in FATA (0.38) in favour of males.
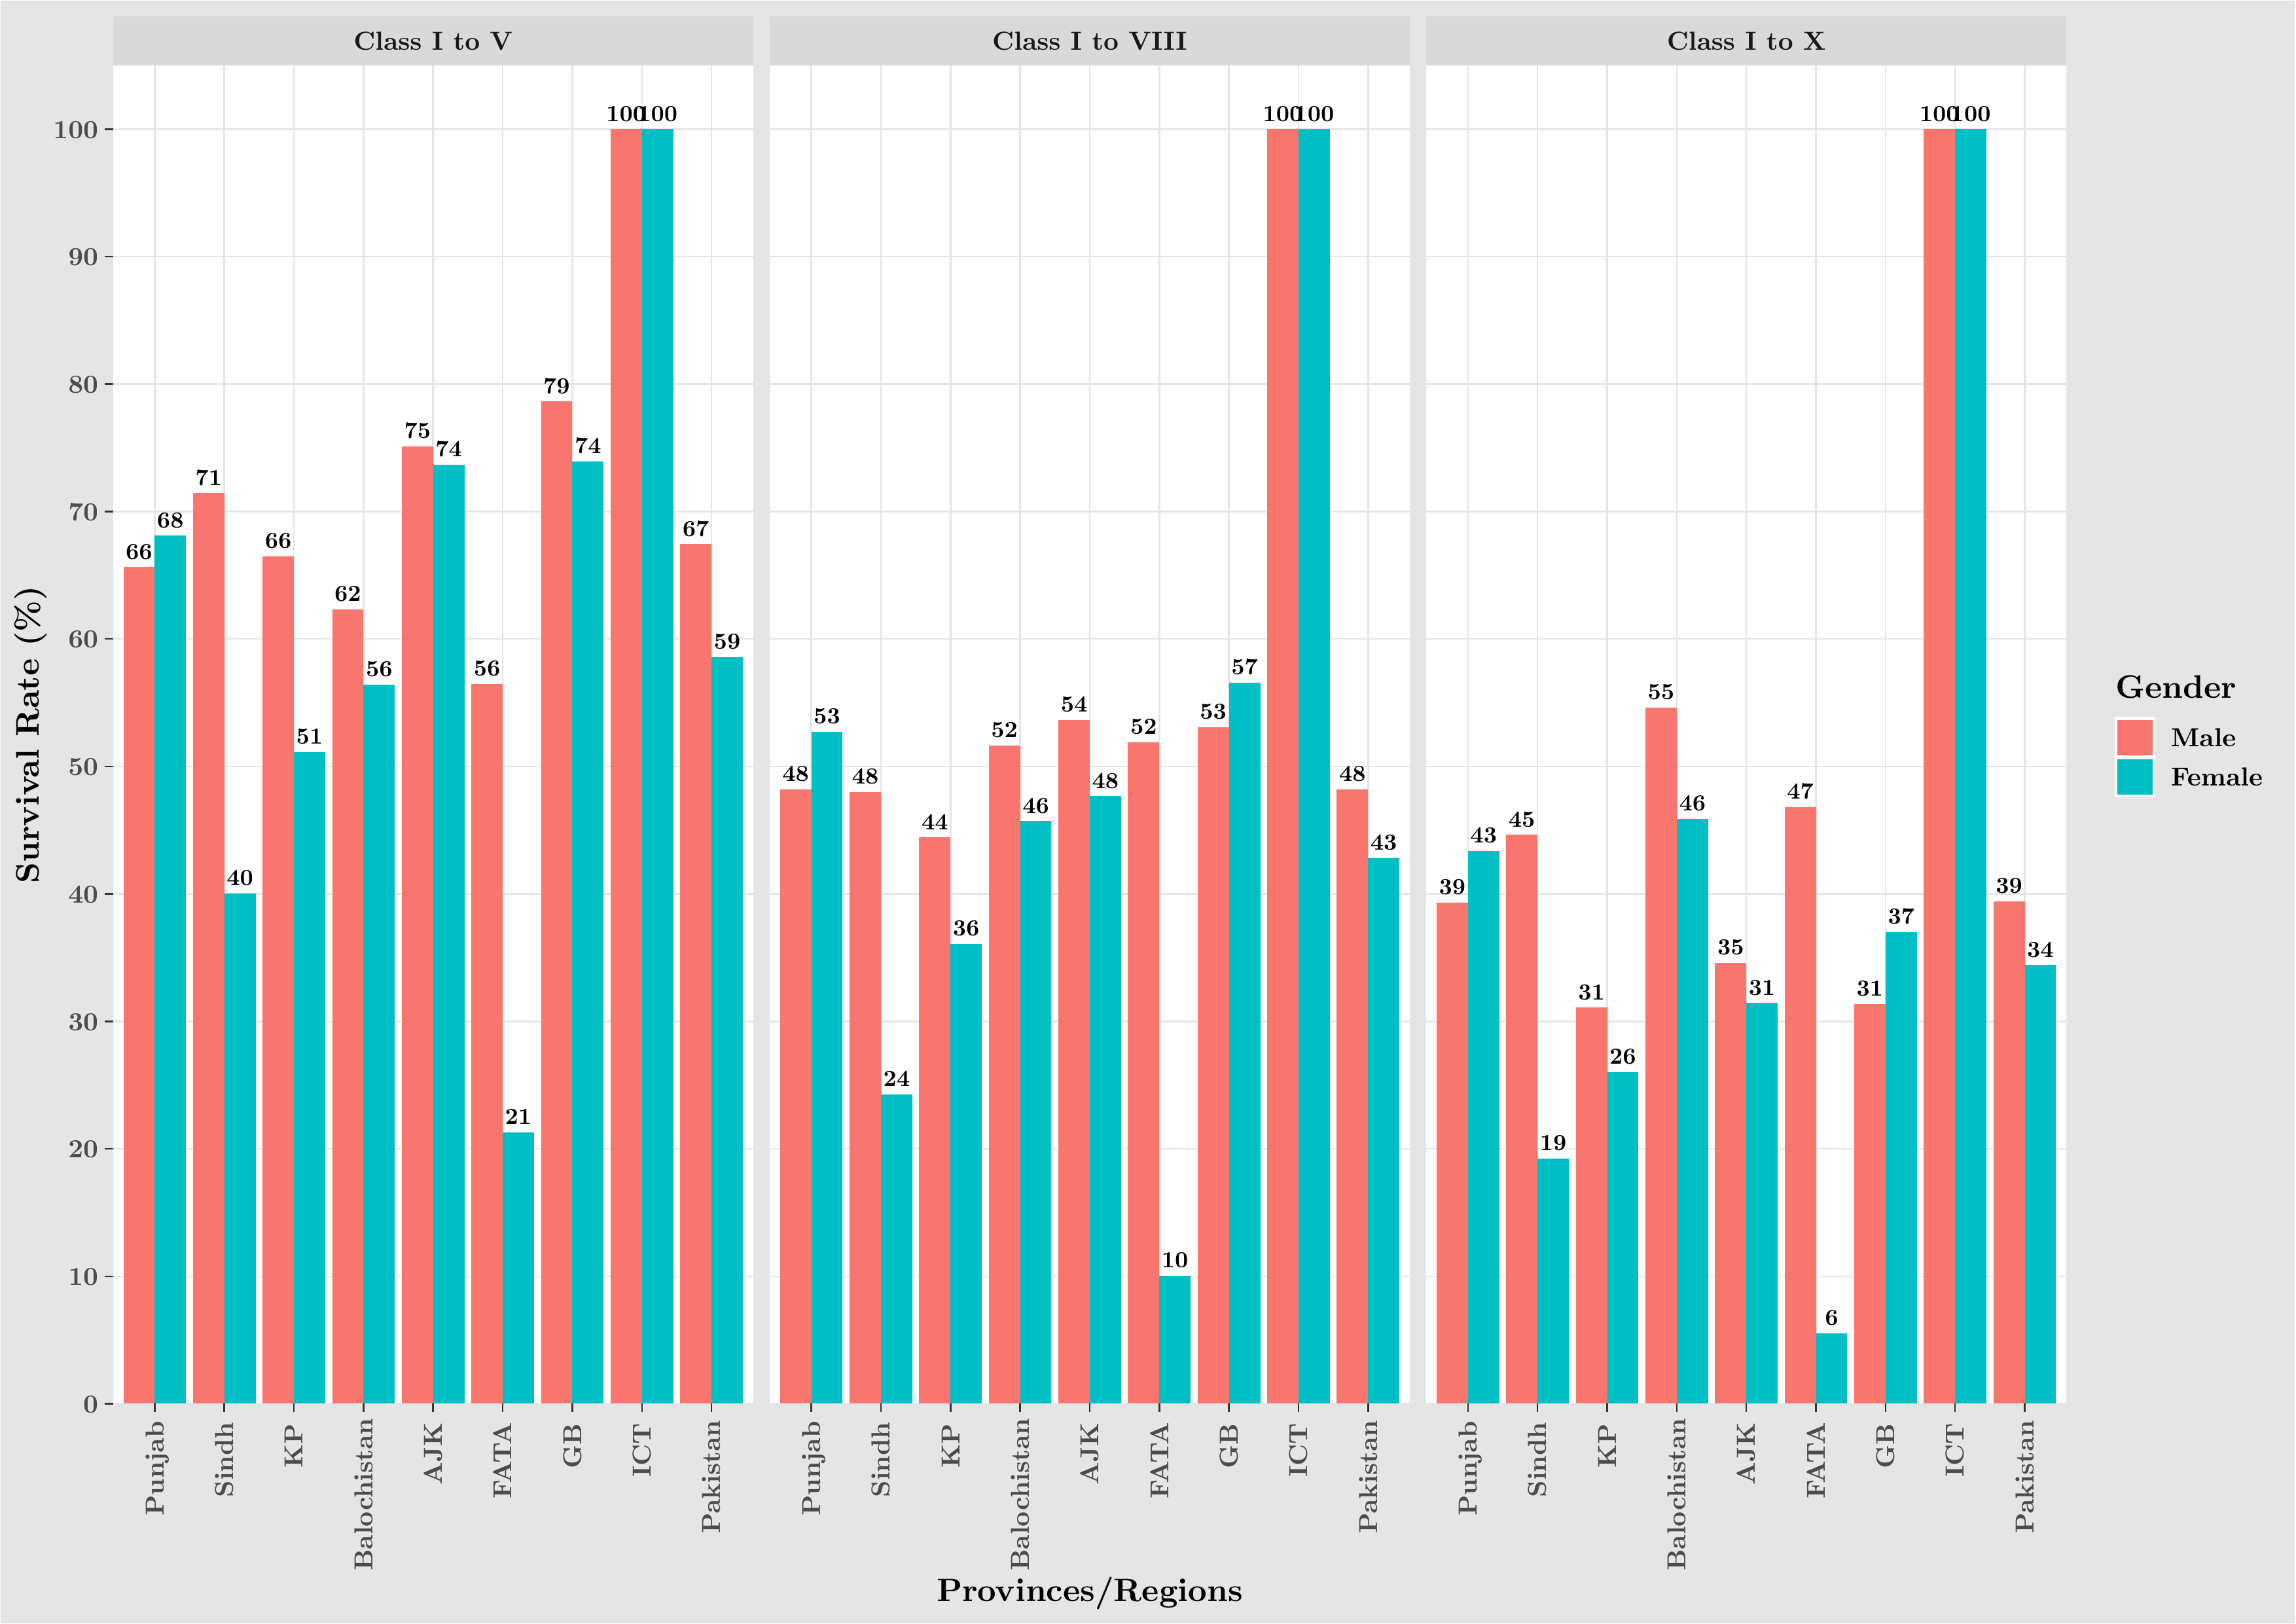
Figure 4.10: Survival Rate by Gender for Provinces/Regions of Pakistan 2017-18
Class I-VIII survival rate for male and female at national level was observed as 48 and 43 respectively. Minimum was observed at 10 percent for females in FATA while maximum was observed for 100 percent for both males and females in ICT.
The survival rate was reduced further to 39 and 34 percent for males and females at Class-X showing 28 and 25 percent reduction from Primary to Secondary level. In the Provinces/Regions only Punjab has better survival percentages for females (68, 53, and 43) as compared to (66, 48, and 39) for males for V, VIII and X grades respectively (Fig. 4.10).
4.3.2 Pupil Teacher, Pupil School, and Teacher School Ratios
PTR, PSR, and TSR are one of the most common indicators used in educational planning. A low number of pupils per teacher indicate pupils will have a better chance of contact with the teachers and hence an improved teaching-learning process. The PTR should normally be compared to the established national norms on the number of pupils per teacher for each level or type of education. A high pupil-teacher ratio suggests that each teacher has to deal with a large number of pupils and that, conversely, pupils receive less attention from the teacher. This affects quality of learning.
The ratio of students to teaching staff is also an important indicator of the resources devoted to education by the government. Pupil teacher ratio by education level and public/private sector for Provinces/Regions is given in Fig. 4.11. It portrays that generally PTR are on the lower side at all levels in the private sector. PTR in Public sector educational institutions is almost double than that in the private sector at the primary level which is a clear indicator of better availability of teachers to students at the basic level of education. This disparity is even more acute in Punjab and KP as compared to other Provinces/Regions. In Punjab similar situation persist at higher levels of education.
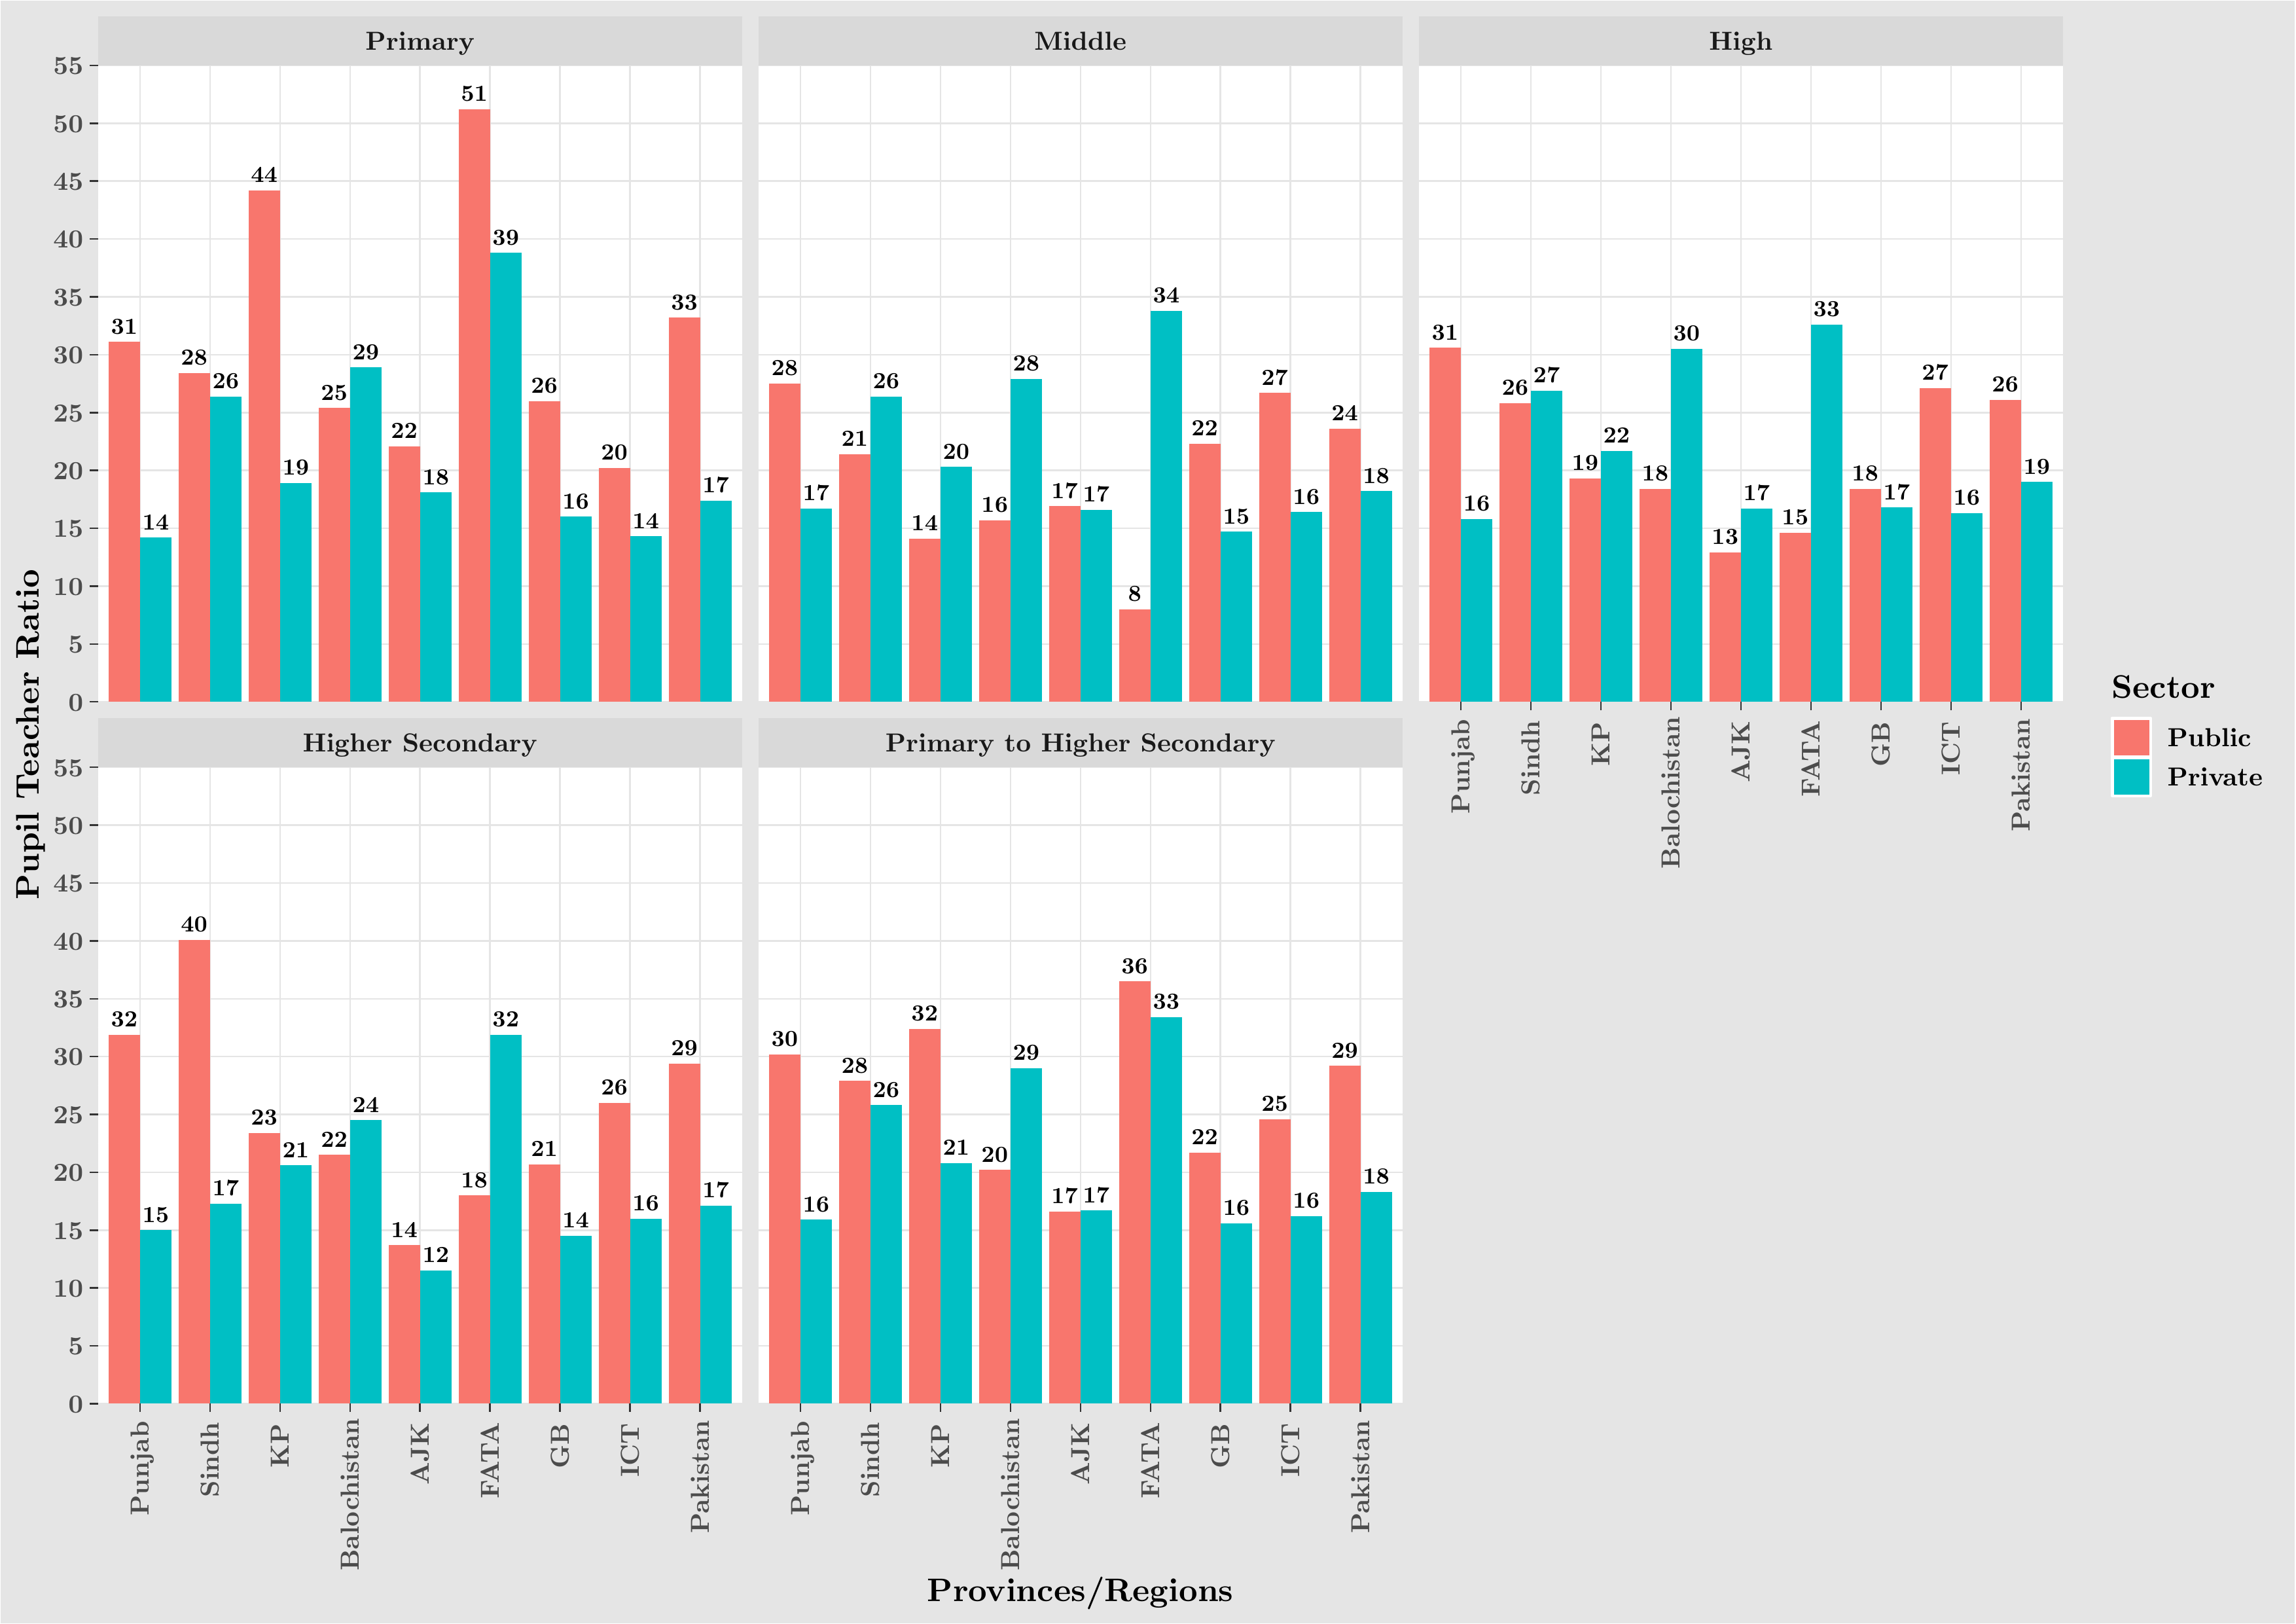
Figure 4.11: Pupil Teacher Ratio by Education level and Sector for Provinces/Regions of Pakistan 2017-18
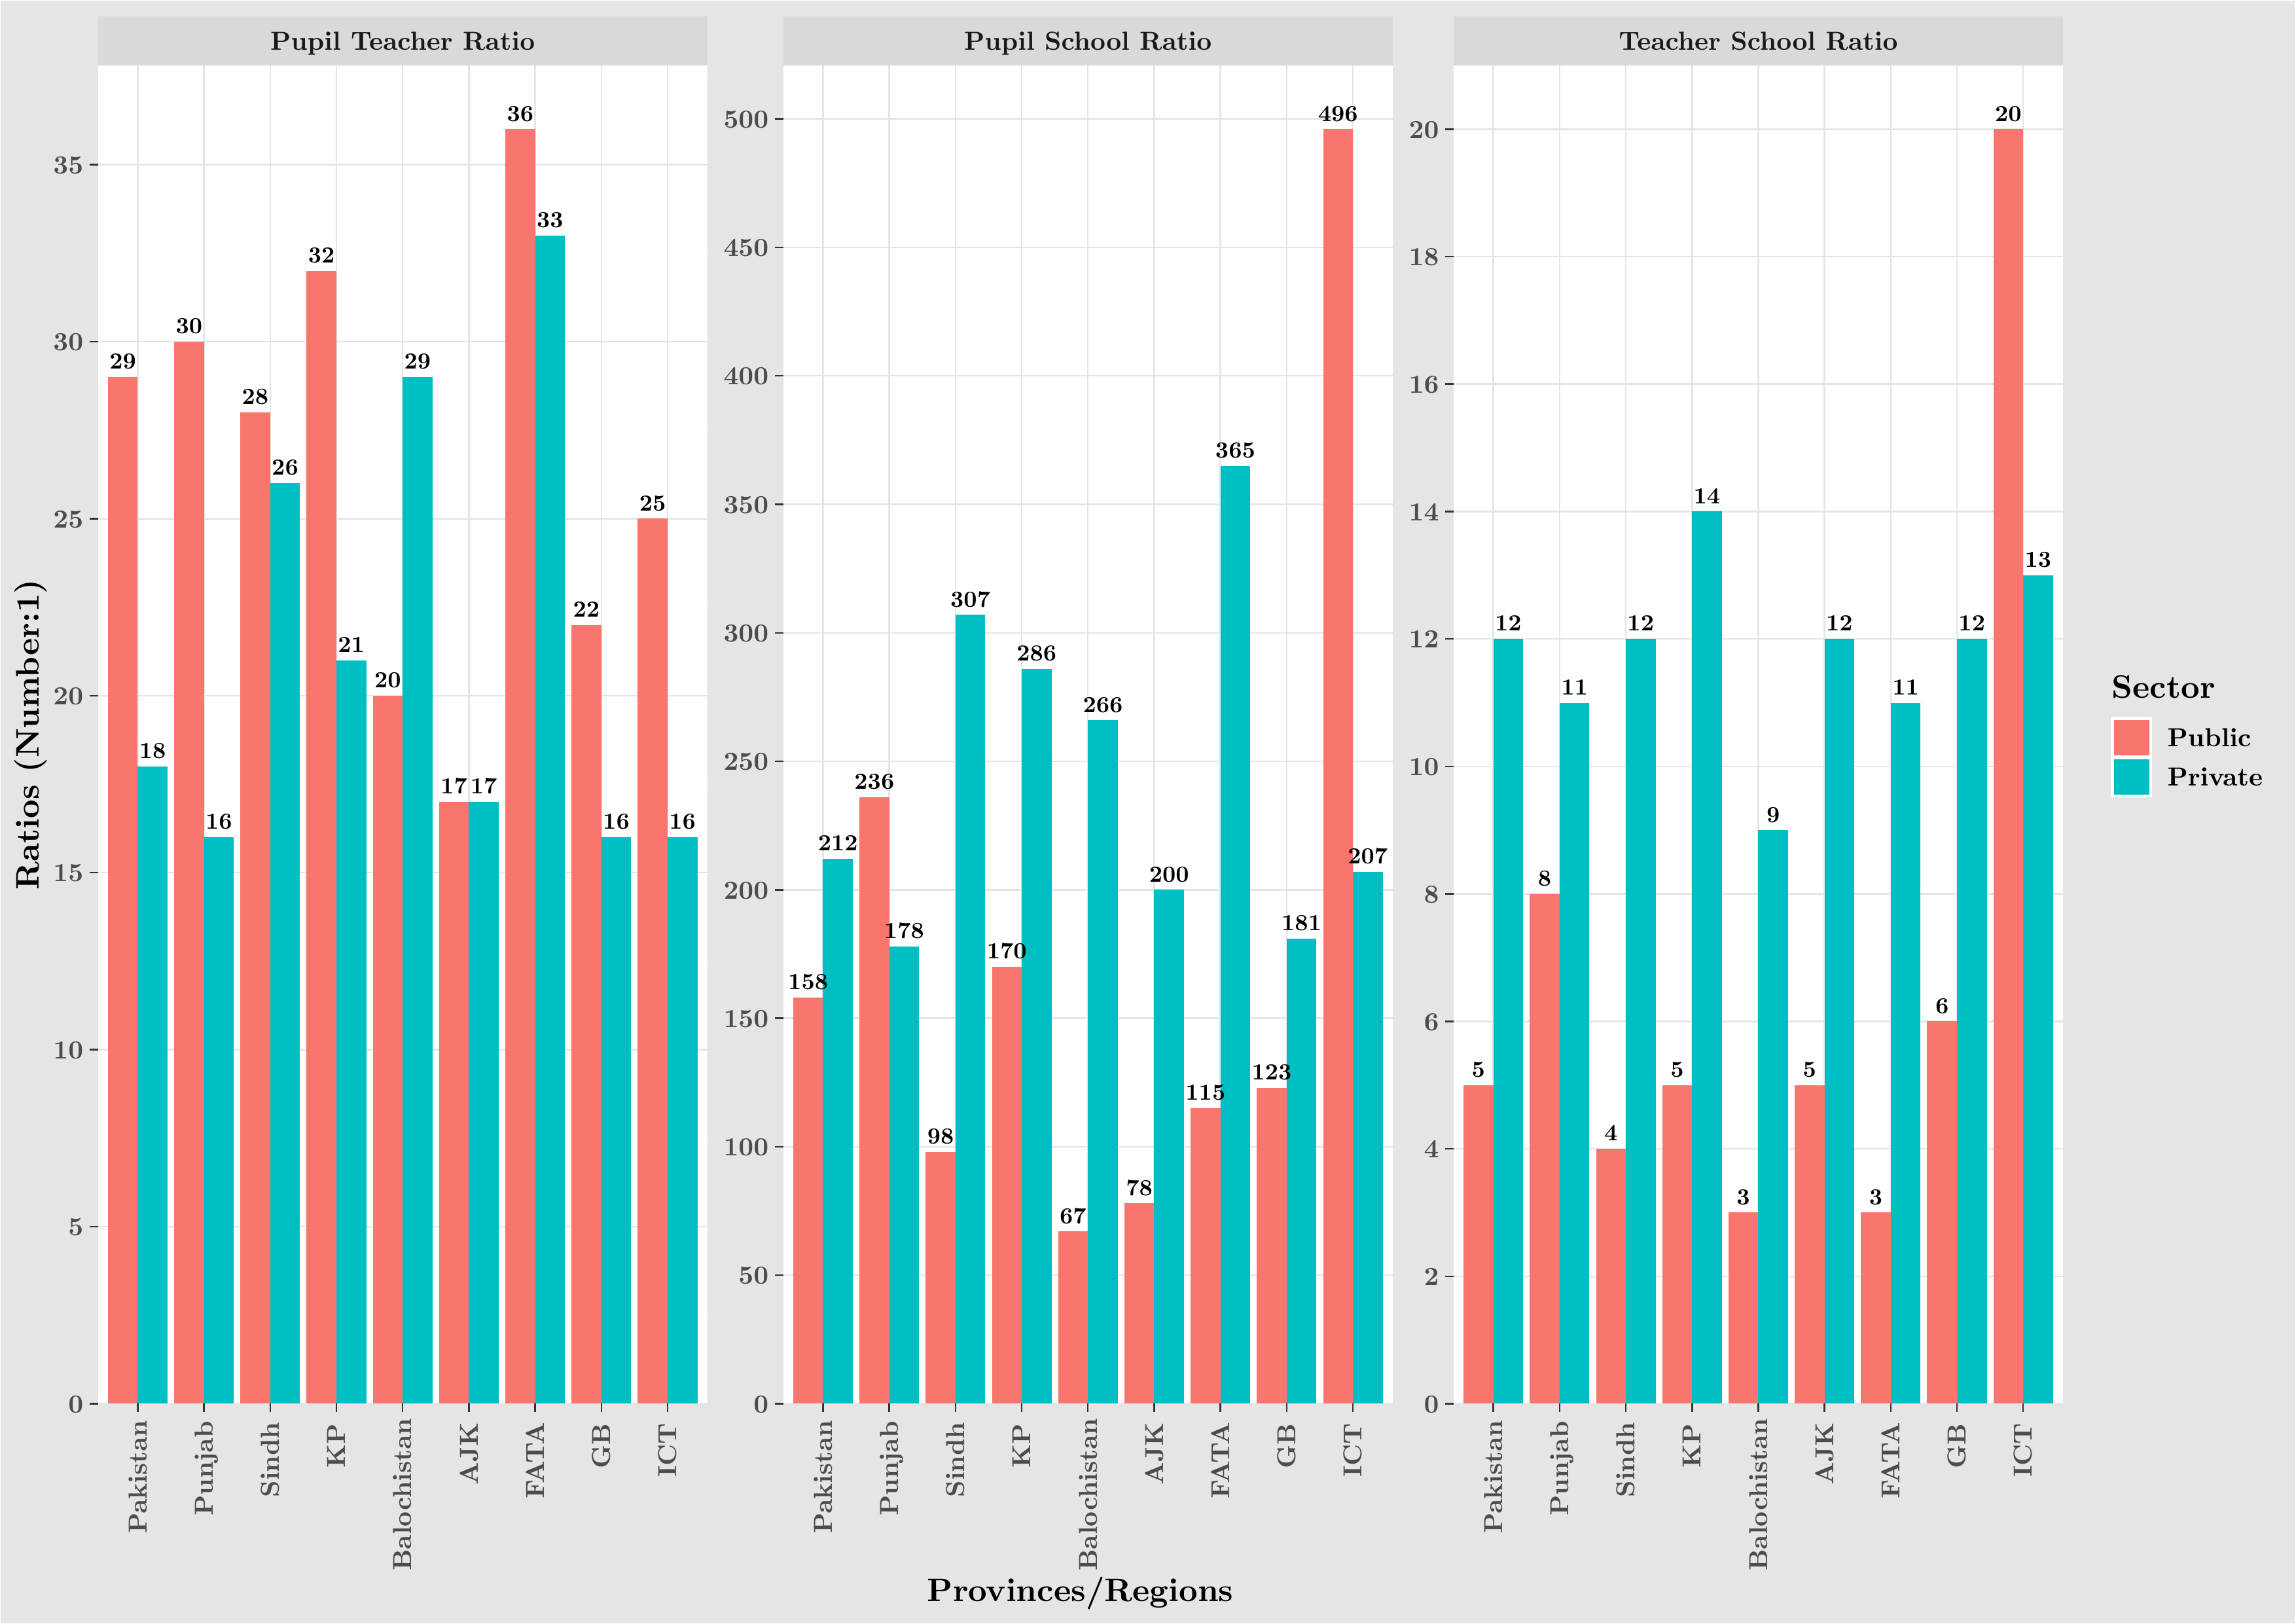
Figure 4.12: Pupil Teacher, Pupil School and Teacher School Ratios by Sector for Provinces/Regions of Pakistan 2017-18
A comparison of Pupil Teacher, Pupil School and Teacher School Ratios by sector and Provinces/Regions for 2017-18 is given in Fig. 4.12. At national level the Pupil Teacher ratio was 29:18 for public and private sector. This varied from as low as 17 in AJK to as high as 36 in FATA for public sector. The corresponding numbers for private sector were 16 to 33 for Punjab, ICT, GB and FATA.
Pupil School ratio at national level was 158 and 212 for public and private sectors respectively. This varied from as low as 67 in Balochistan to as high as 496 in ICT for public sector schools. The corresponding numbers for private sector were 178 in Punjab to 365 in FATA.
The Teacher School Ratio at the national level was 5 to 12. It was always smaller for public sector school as compared to private sector schools with the exception of ICT with 20 to 13 for public versus private schools.
4.3.3 Pupil Classroom Ratio (PCR)
PCR is an important indicator to measure the quality of education at a particular level of education. A low pupil classroom ratio is often perceived good. This means as enough classrooms are available and less number of students in a classroom which facilitates teachers to focus more on the needs of individual students, thus reducing the amount of class time they spend dealing with disruptions.
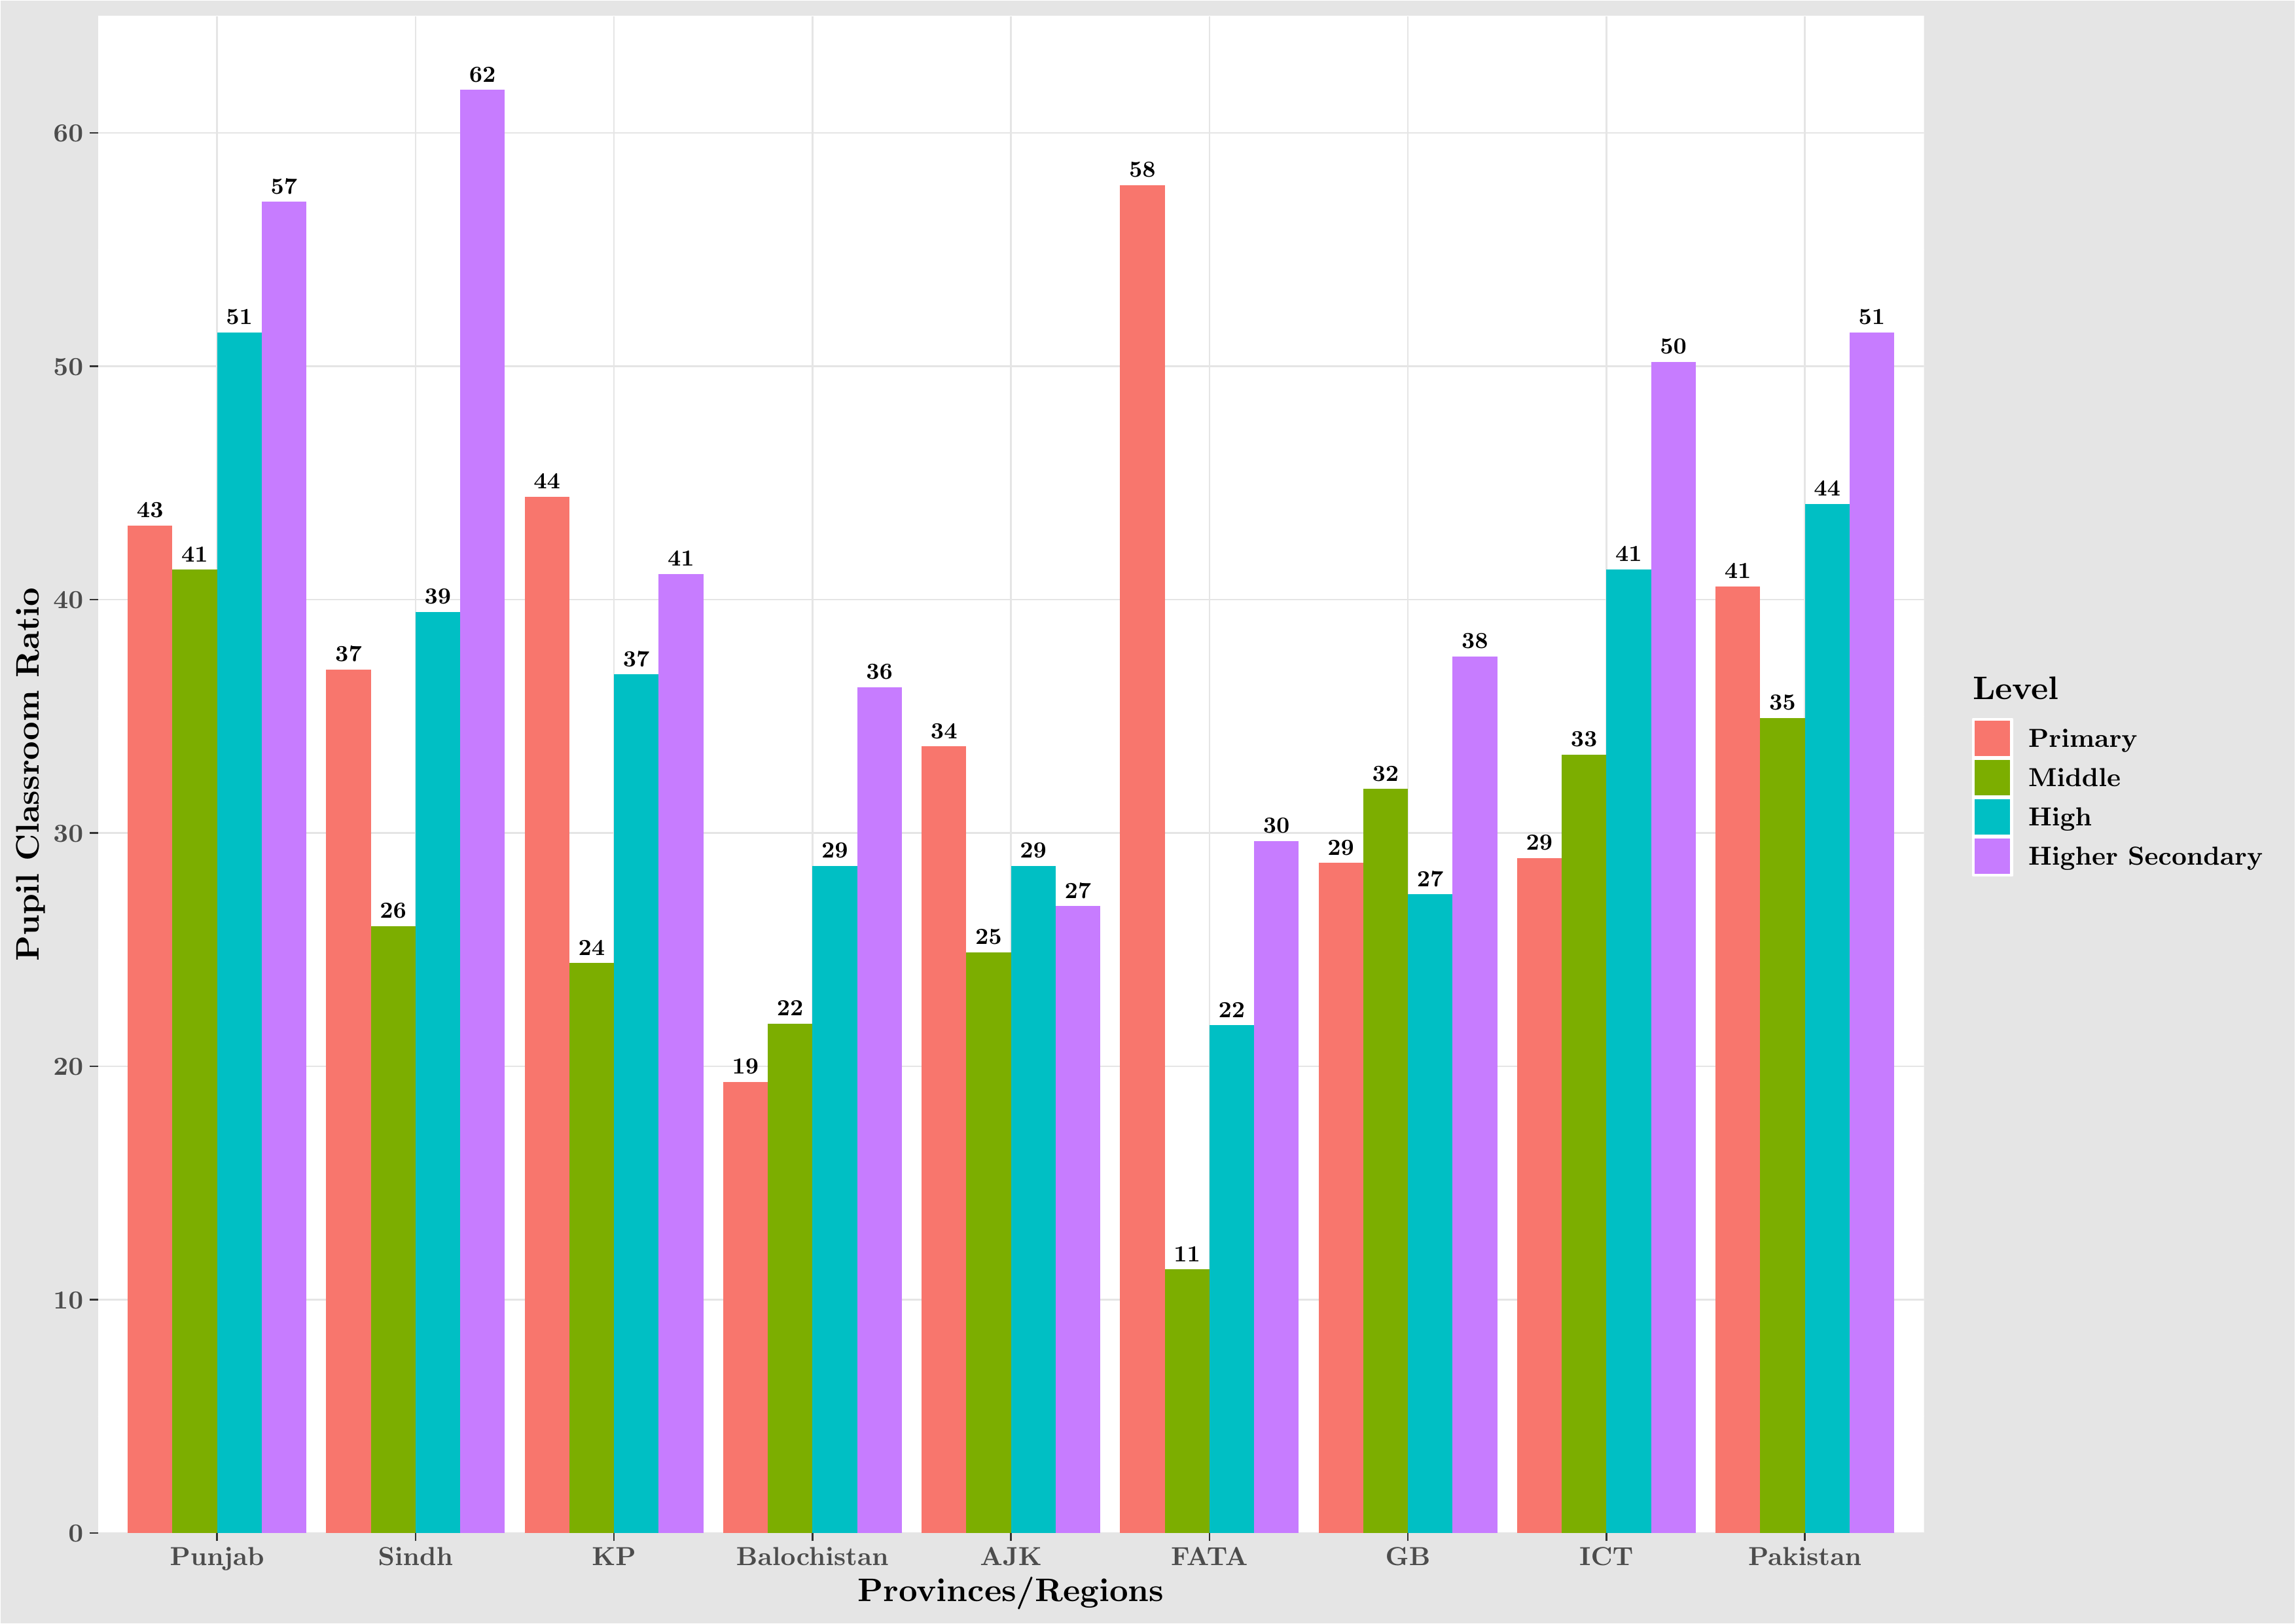
Figure 4.13: Pupil Classroom Ratio by Education level and Sector for Provinces/Regions of Pakistan 2017-18
PCR’s for educational levels and provinces/regions are given in Fig. 4.13. It shows that class sizes increase from primary (41) to higher secondary level (51). at national level. There is lot of variability in the provinces/regions.
4.3.4 Availability of Electricity
In the summer season, non-availability of electricity affects the performance of teachers as well as students, especially in the hot areas. The performance of schools having computer and science labs are also severely affected by the non-availability of electricity. Fig. 4.14 presents the status of availability of electricity in schools of Pakistan. At national level the availability of electricity in primary, middle, high, and higher secondary schools is 68, 82, 93, and 97 percent respectively. The situation is pathetic in primary and middle schools of Balochistan, AJK, FATA, and GB.
4.3.5 Availability of Drinking Water
Water is basic necessity of life. Availability of clean drinking water is an essential need of all population groups, especially young children attending school. Fig. 4.15 portrays the availability of drinking water by education level for provinces / regions. Here again situation in primary and middle schools needs major improvement in Balochistan, AJK, FATA, GB, and Sindh.
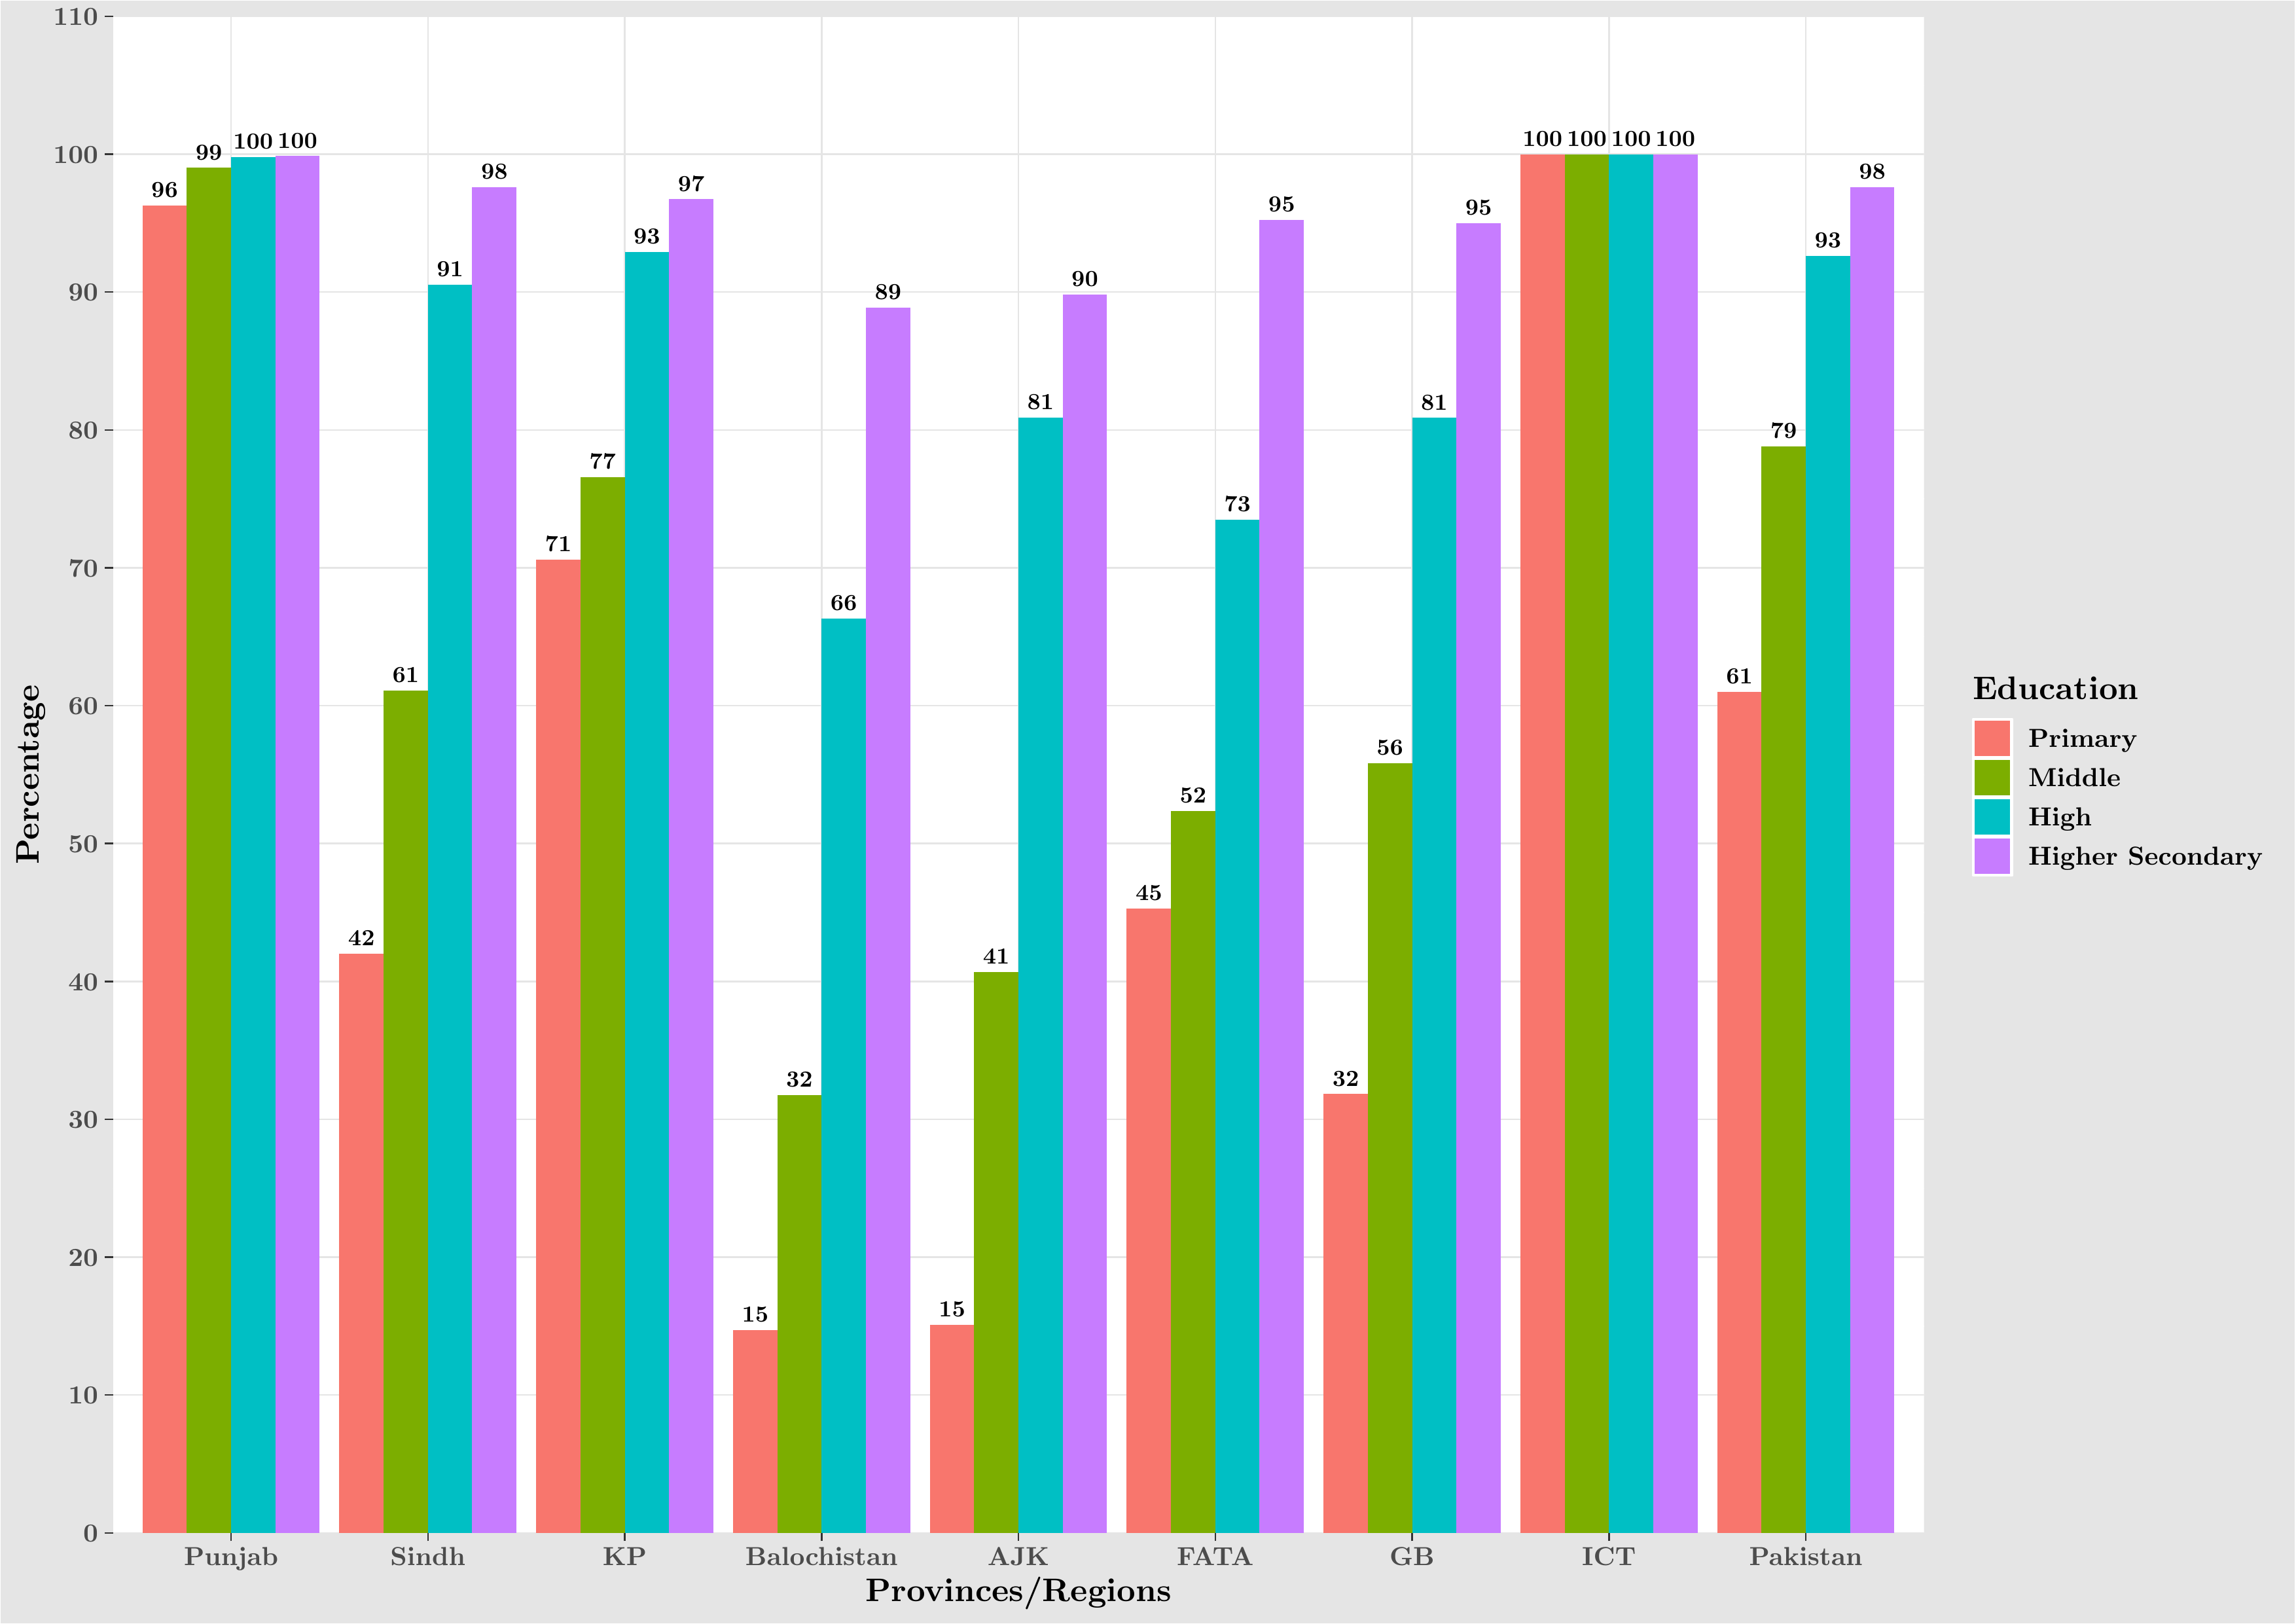
Figure 4.14: Availability of Electricity by Education level for Provinces/Regions of Pakistan 2017-18
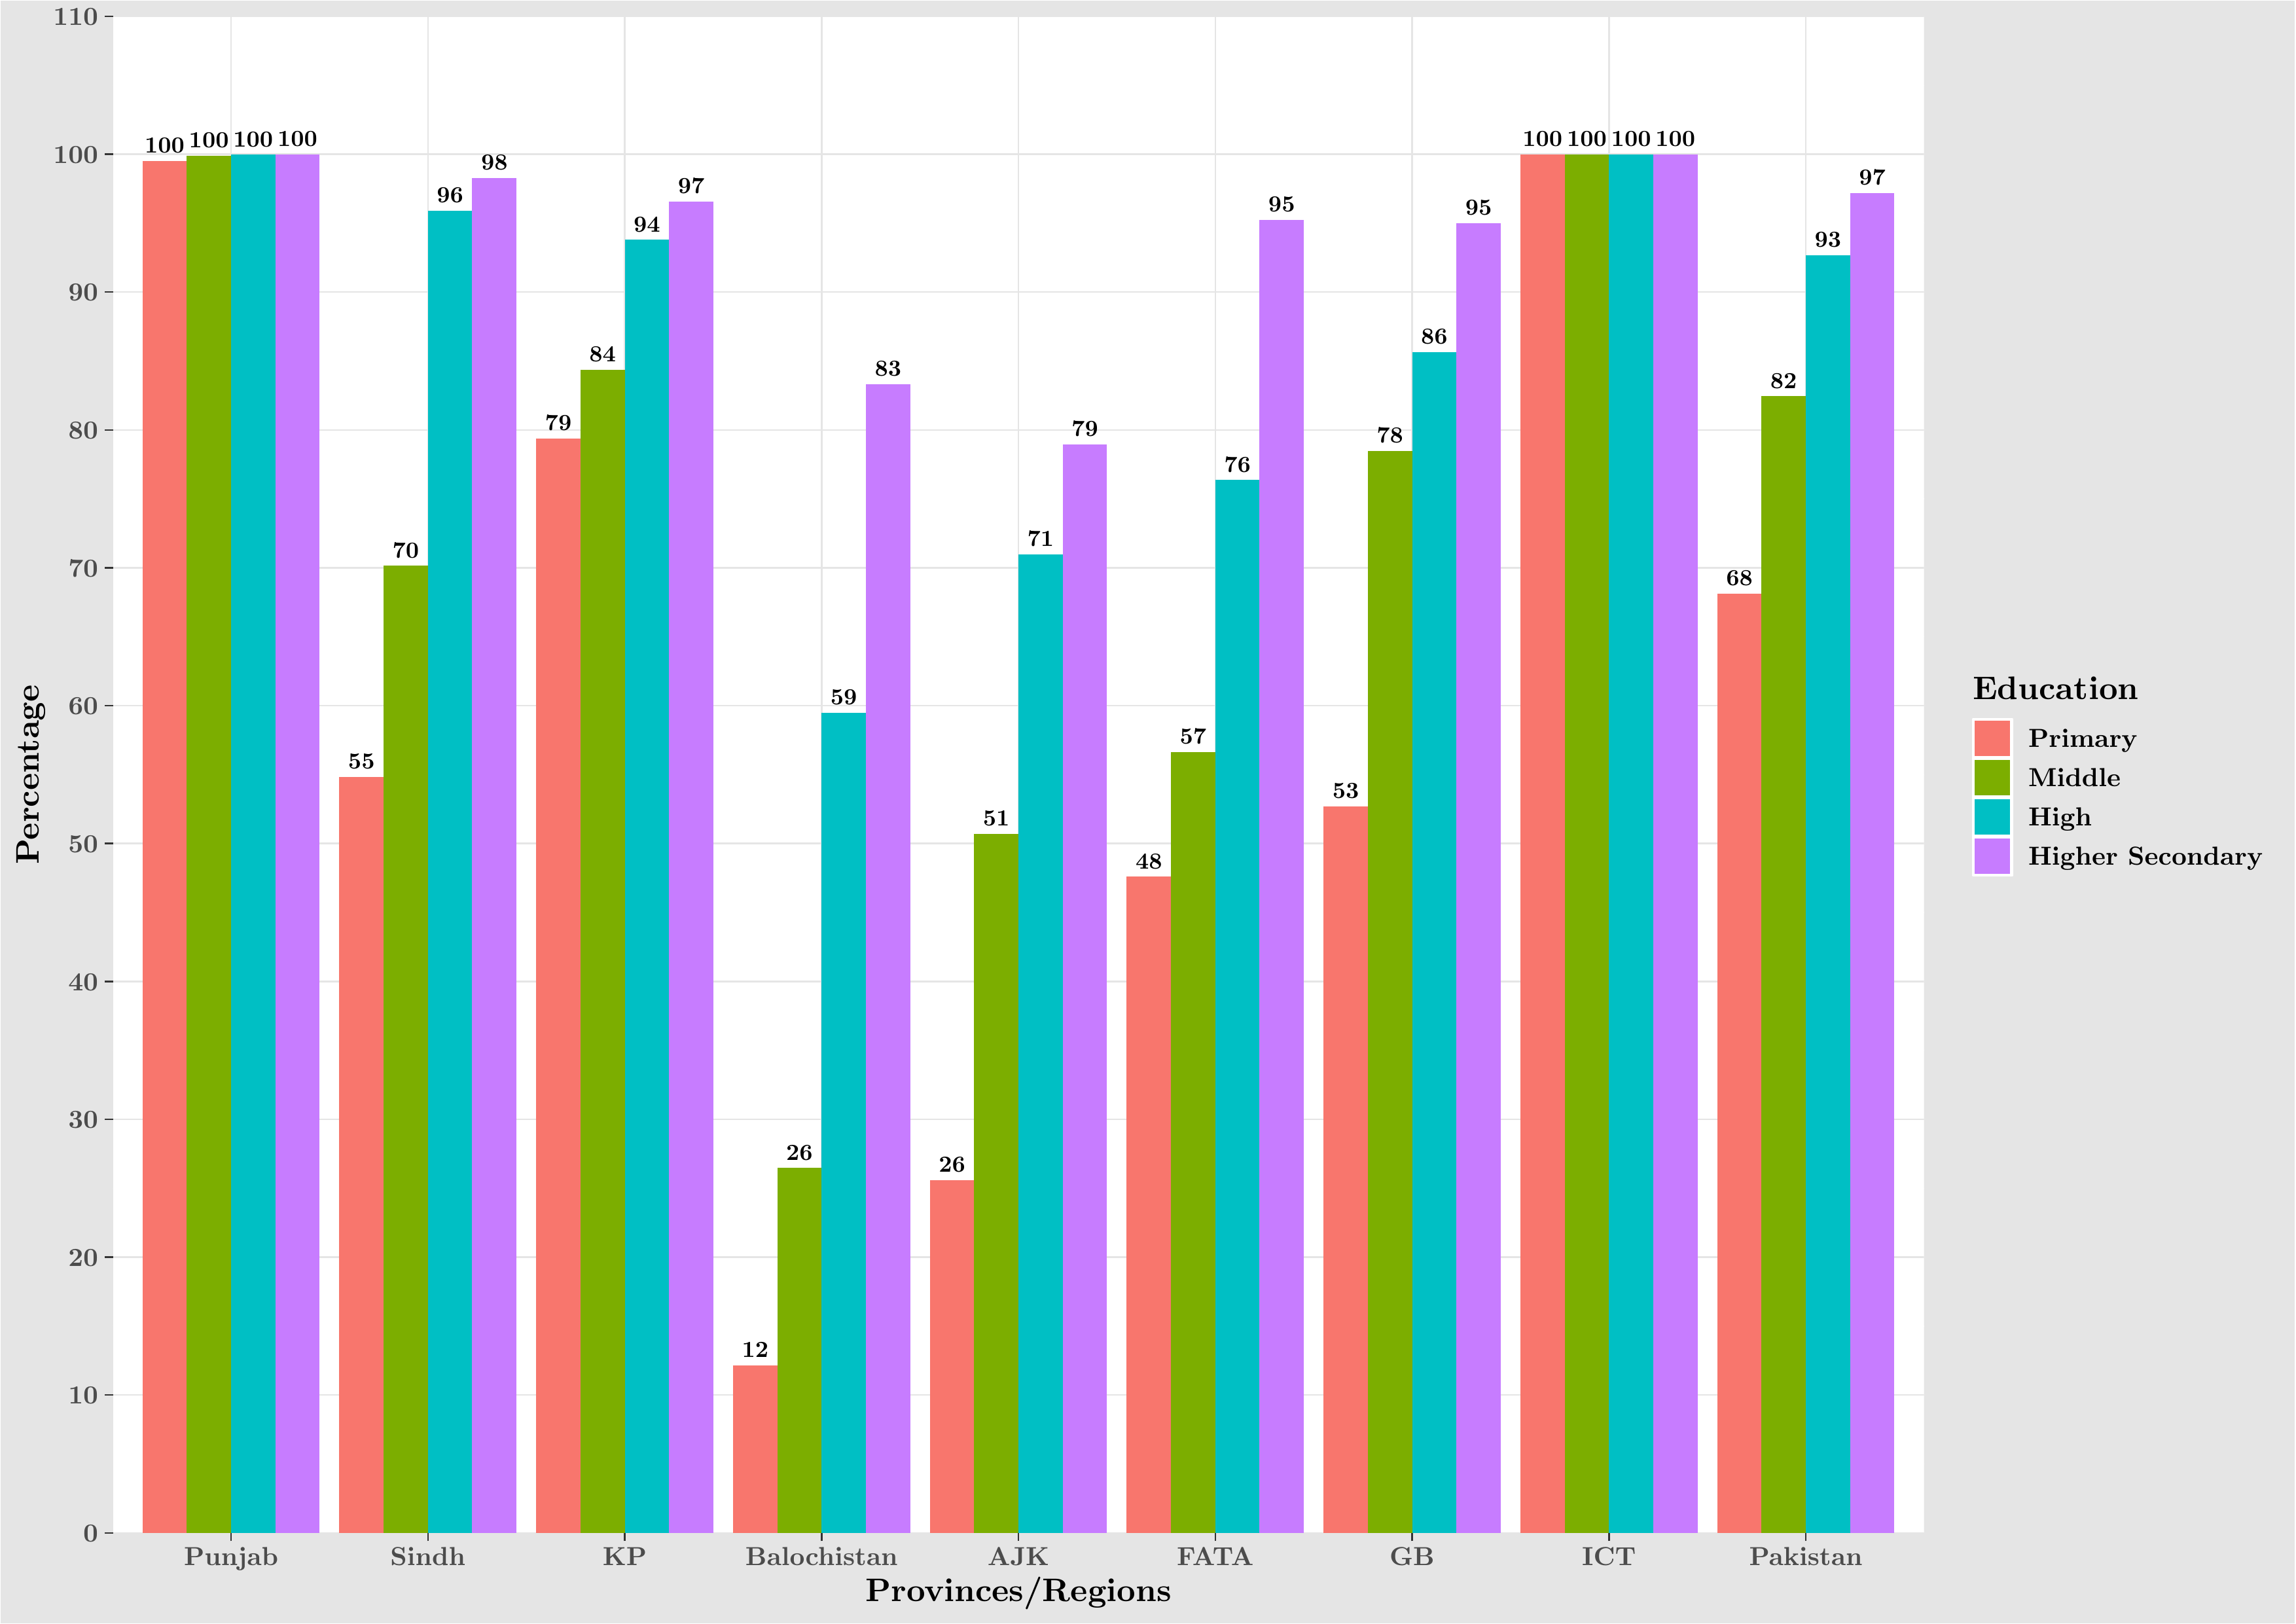
Figure 4.15: Availability of Drinking Water by Education level for Provinces/Regions of Pakistan 2017-18
4.3.6 Availability of Toilets for Students
This is another essential facility which may become critical in female schools. It has been observed that even when this facility is reported to be available, there are many instances where the facility is un-usable due to poor maintenance, and practically the schools are without this facility. The percentage of availability are below percent in Balochistan, AJK, FATA, and GB primary schools while in Punjab and ICT it was hundred percent for all levels (Fig. 4.16).
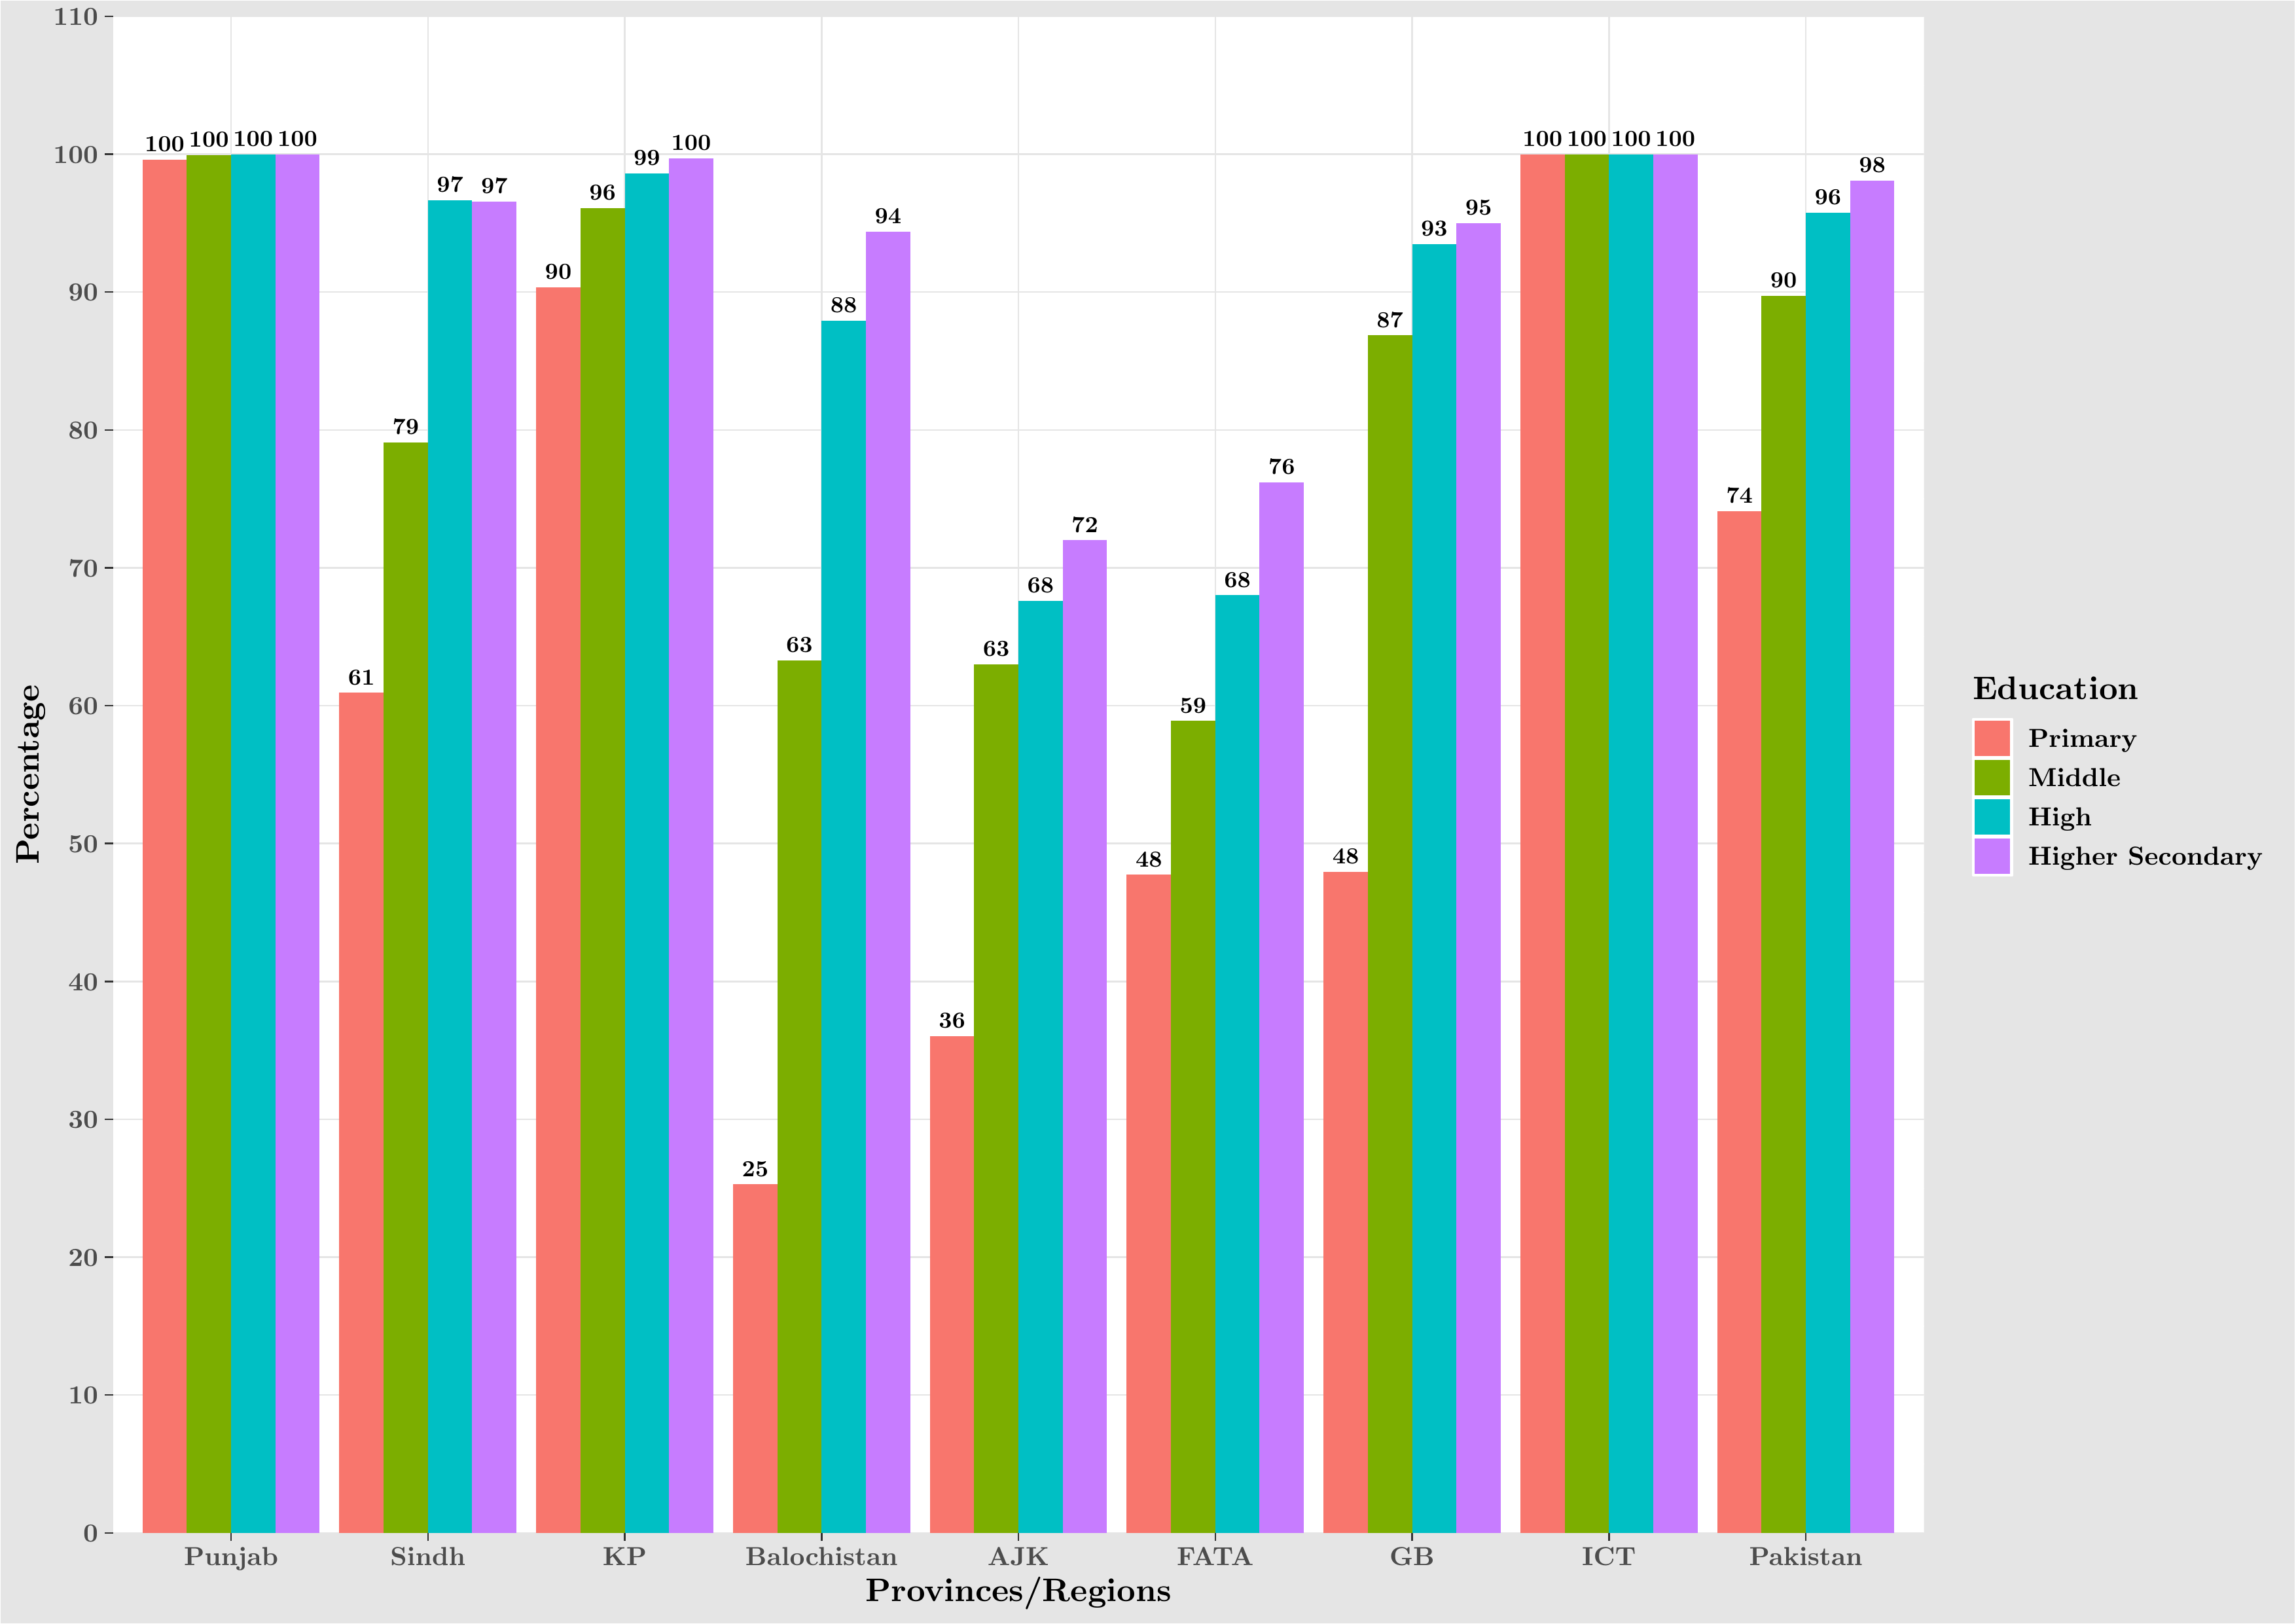
Figure 4.16: Availability of Toilets by Education level for Provinces/Regions of Pakistan 2017-18
4.3.7 Availability of Boundary Wall
The availability of boundary wall is gaining increased importance due to law and order situation. This becomes more critical in case of female education institutions where a boundary wall is a must. This facility was much below the national average for primary and middle level for Sindh, Balochistan, AJK, FATA, and GB. Punjab, KP, and ICT has better position for all levels (Fig. 4.17).
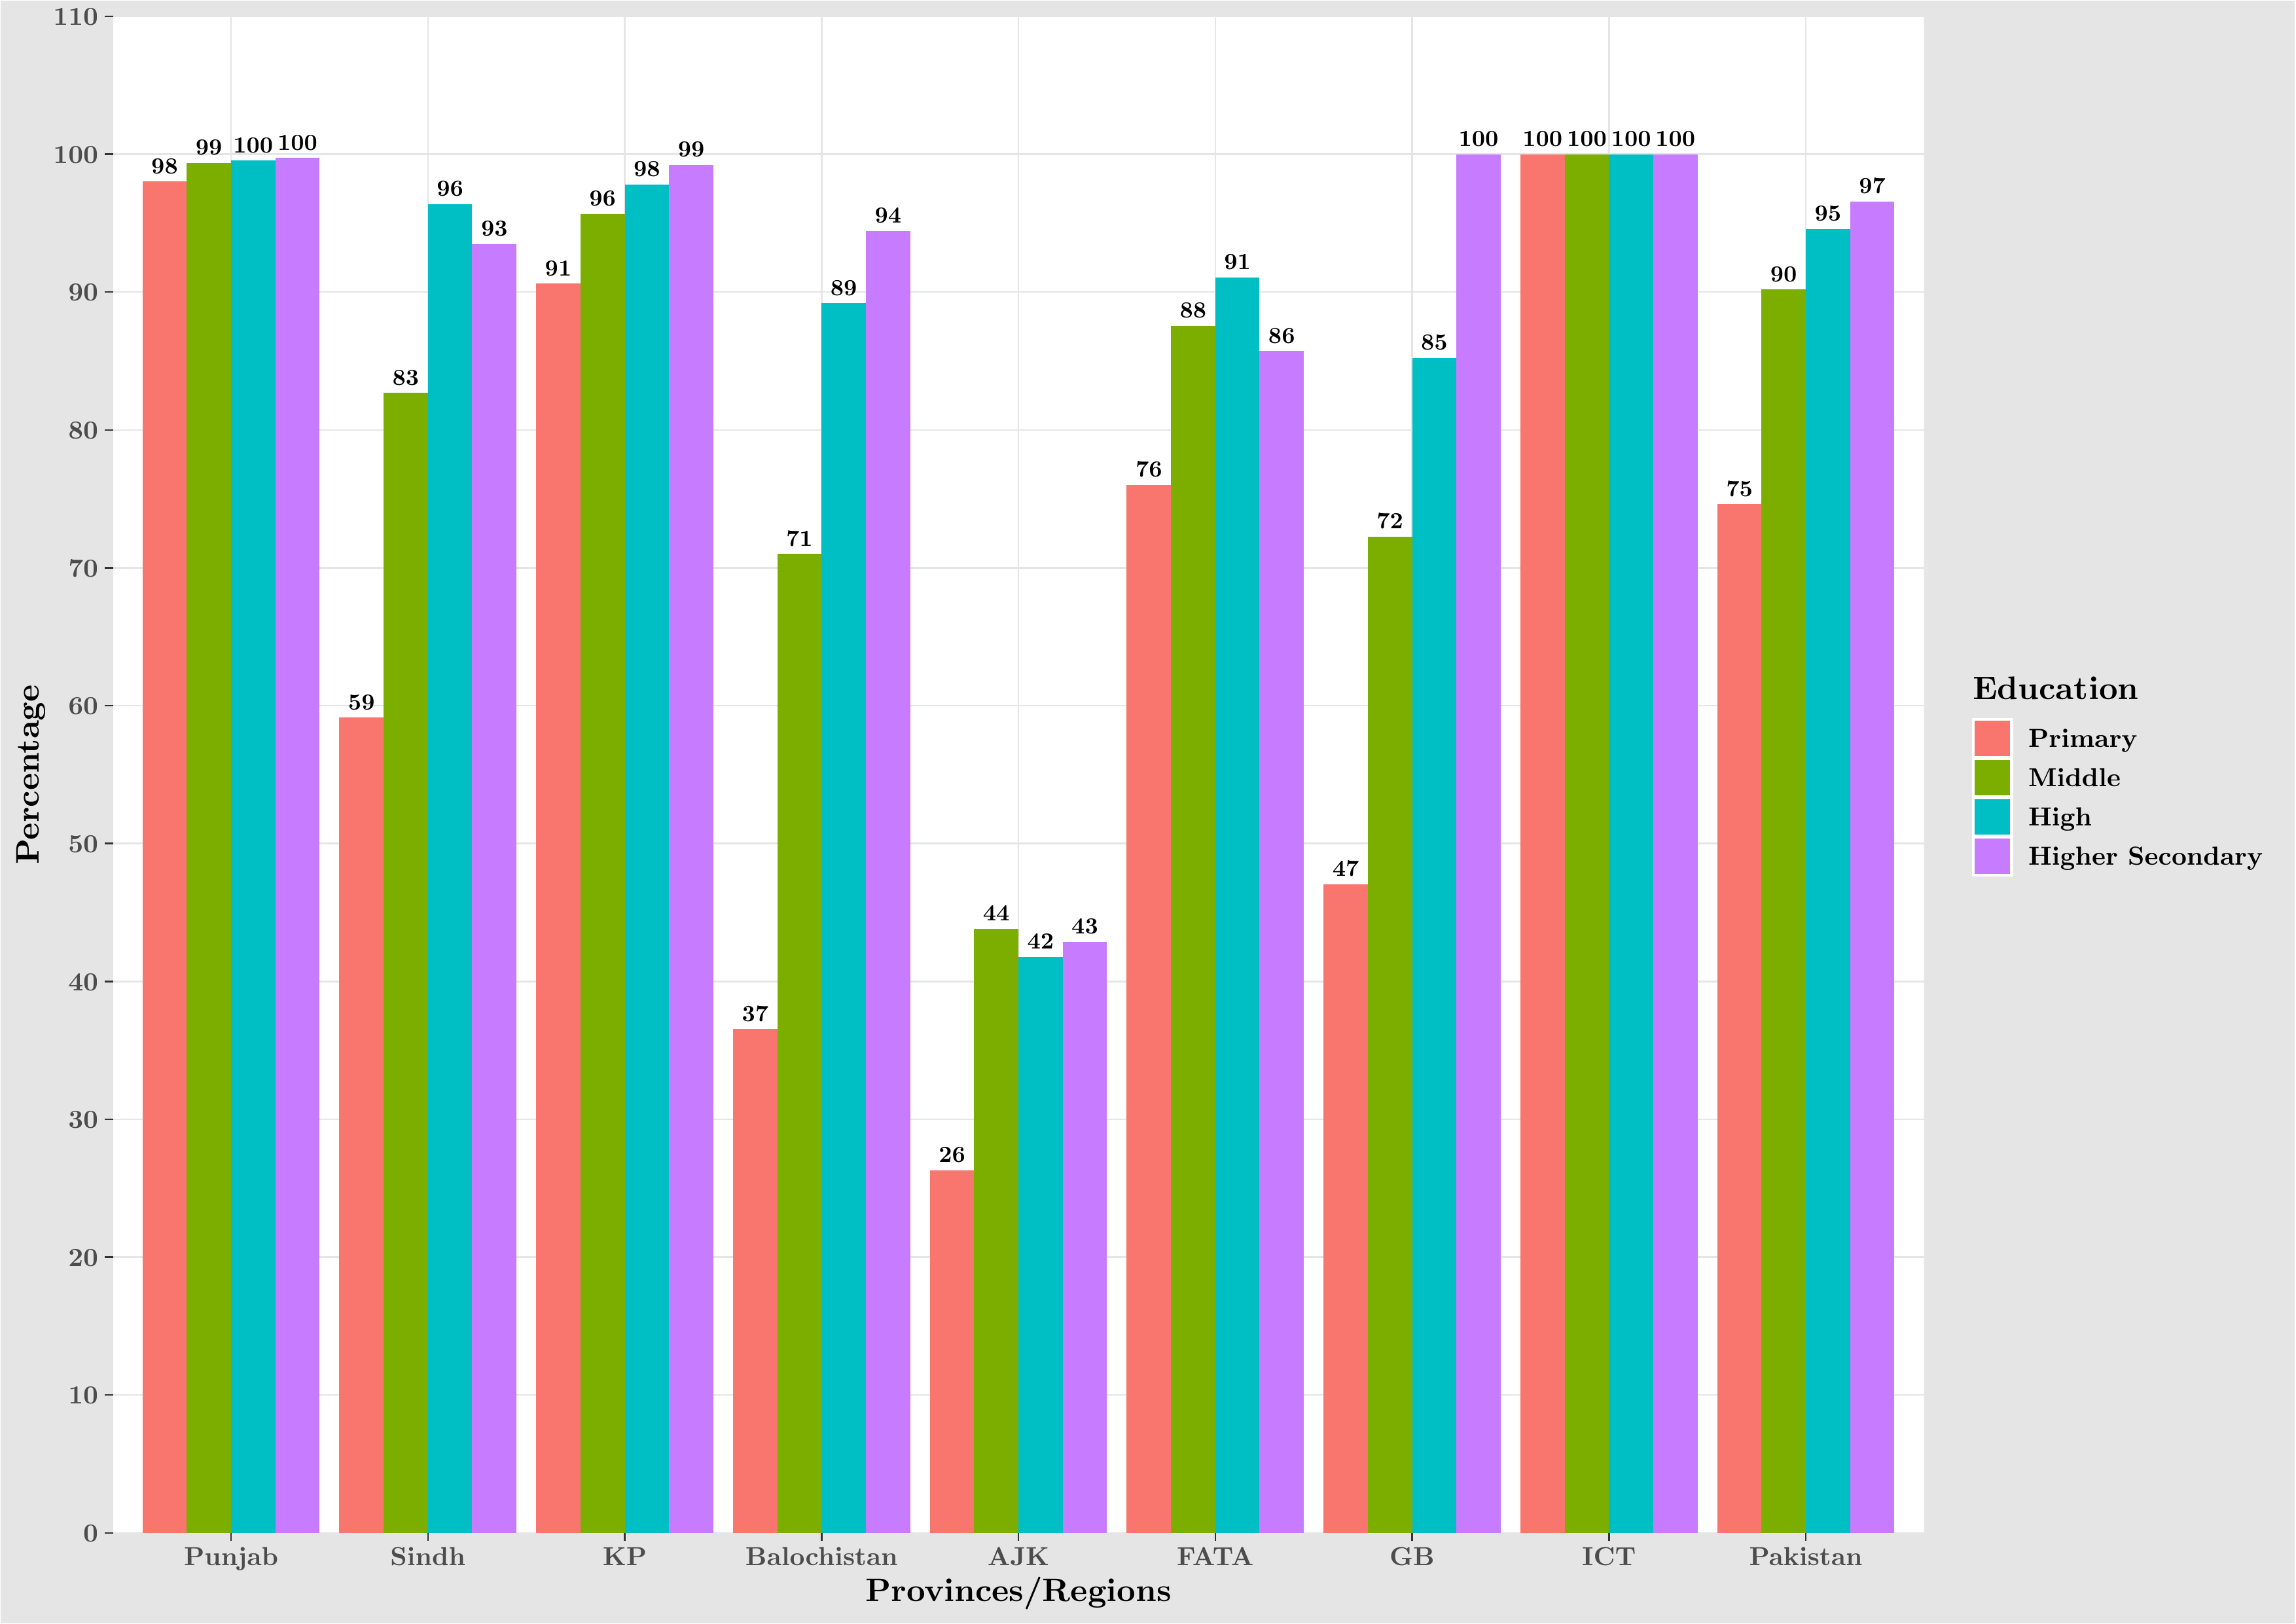
Figure 4.17: Availability of Boundary Wall by Education level for Provinces/Regions of Pakistan 2017-18