MYaseen208
Thoughts on statistics, Research, R, Python, LaTex, and other distractions.All posts by date
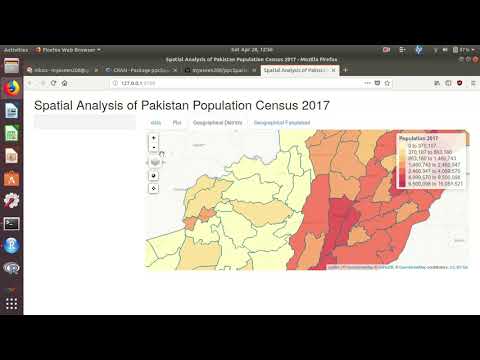
Spatial Analysis of Pakistan Population Census 2017
The latest version of the ppcSpatial package for R is now on CRAN. It performs spatial analysis for exploration of Pakistan Population Census 2017 (http://www.pbscensus.gov.pk/). It uses data from R package PakPC2017.
The Spatial map is
and full view is here.
A video showing some functionality of the package is
An introduction to R for Agricultural Research
Introduction Regression Analysis Simple Linear Regression Example Example Example Multiple Linear Regression Example Polynomial Regression Analysis Example Analysis of Variance (ANOVA) Example Example Analysis of Covariance (ANCOVA) Example Same intercepts but different slopes Different intercepts and different slopes Correlation Analysis Simple Correlation Analysis Example Partial Correlation Analysis Example Multiple Correlation Analysis Example Completely Randomized Design (CRD) Example Randomized Complete Block Design (RCBD) Example Latin Square Design Example Introduction R is a free, open-source programming language and software environment for statistical computing, bioinformatics, visualization and general computing.ppcSpatial: Spatial Analysis of Pakistan Population Census
The latest version of the ppcSpatial package for R is now on CRAN. It performs spatial analysis for exploration of Pakistan Population Census 2017 (http://www.pbscensus.gov.pk/). It uses data from R package PakPC2017.
A video showing some functionality of the package is
VetResearchLMM v1.0.0 on CRAN
The latest version of the VetResearchLMM package for R is now on CRAN. This package provides R Codes and Datasets for Duchateau, L. and Janssen, P. and Rowlands, G. J. (1998). Linear Mixed Models. An Introduction with applications in Veterinary Research. International Livestock Research Institute. The latest version of the package is prepare for new version of lmerTest.
Diallel Analysis with R
The latest versin 0.1.1 of DiallelAnalysisR is aviable on CRAN. It performs Diallel Analysis with R using Griffing’s and Hayman’s approaches. Four different methods (1: Method-I (Parents + F1’s + reciprocals); 2: Method-II (Parents and one set of F1’s); 3: Method-III (One set of F1’s and reciprocals); 4: Method-IV (One set of F1’s only)) and two methods (1: Fixed Effects Model; 2: Random Effects Model) can be applied using Griffing’s approach.Help
This is not a help service for all your Statistics, R, Python and/or LaTeX questions, so please don’t post questions in the comments, or send them to me by email. If you have questions about Statistics and/or data analysis, ask for help on crossvalidated.com. If you have questions about R, ask for help on stackoverflow.com. If you have questions about Python, ask for help on stackoverflow.com. If you have questions about LaTeX, ask for help on stackoverflow.About myaseen208
This is my blog site where I will put my thoughts about Statistics, R, Python, LaTeX and Research.