MYaseen208
Thoughts on statistics, Research, R, Python, LaTex, and other distractions.Subject ▸ R
An Introduction to R Programming Language
Introduction R is a free, open-source programming language and software environment for statistical computing, bioinformatics, visualization and general computing. R provides a wide variety of statistical and graphical techniques, and is highly extensible. The latest version of R can be obtained from https://cran.r-project.org/bin/windows/base/. R R for Windows (32/64 bit) RStudio RStudio Manual An Introduction to R Ref Card R Reference Card New York Times New York Times Nature Article Nature Article Slides The Slides may be accessed from Slides.Statistics: The Art & Science of Learning from Data
1 Introduction 1.1 Statistics 1.2 Variable 1.3 Measurement 1.4 Measurement Scales 2 Exploring Data with Graphs & Numerical Summaries 2.1 Graphs 2.2 Numerical Summaries 3 Descriptive Statistics 4 Correlation Analysis 5 An Introduction to Linear Models 5.1 Regression Analysis 5.2 Analysis of Variance (ANOVA) 5.3 Analysis of Covariance (ANCOVA) 6 An Introduction to R addClassKlippyTo("pre.r, pre.python"); addKlippy('left', 'top', 'auto', '1', 'Copy code', 'Copied!Design & Analysis of Field Experiments using R
Introduction Regression Analysis Simple Linear Regression Example Example Example Multiple Linear Regression Example Polynomial Regression Analysis Example Analysis of Variance (ANOVA) Example Example Analysis of Covariance (ANCOVA) Example Same intercepts but different slopes Different intercepts and different slopes Correlation Analysis Simple Correlation Analysis Example Partial Correlation Analysis Example Multiple Correlation Analysis Example Completely Randomized Design (CRD) Example Randomized Complete Block Design (RCBD) Example Latin Square Design Example Factorial Experiment under RCBD Stability Analysis Individual Analysis of Variance for each Location Combined Analysis of Variance Additive Main Effects and Multiplicative Interaction (AMMI) Analysis Additive Main Effects and Multiplicative Interaction (AMMI) Biplot Analysis Genotype plus Genotypes by Environment (GGE) Interaction Biplot Analysis Introduction R is a free, open-source programming language and software environment for statistical computing, bioinformatics, visualization and general computing.Training Course on Capacity Building of NARS Scientists in Advance Analytical Techniques
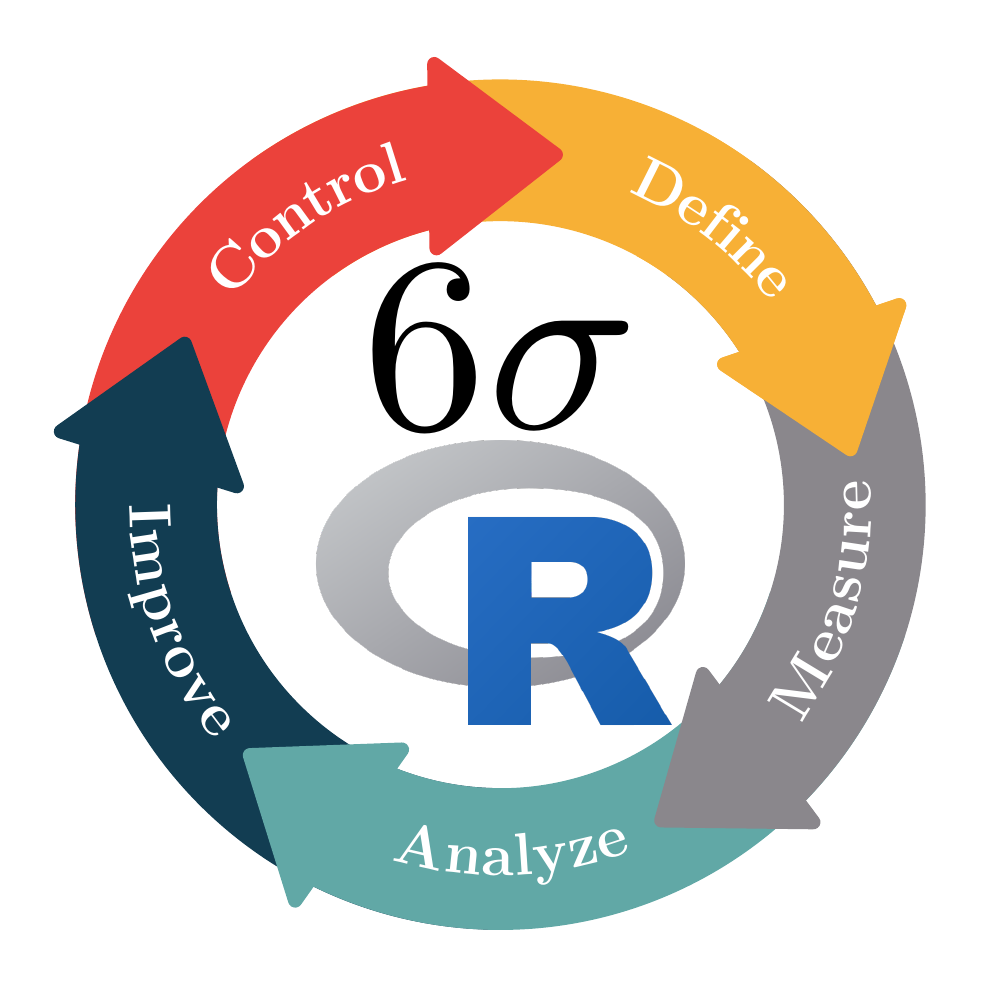
Introduction Regression Analysis Simple Linear Regression Example Example Example Multiple Linear Regression Example Polynomial Regression Analysis Example Analysis of Variance (ANOVA) Example Example Analysis of Covariance (ANCOVA) Example Same intercepts but different slopes Different intercepts and different slopes Correlation Analysis Simple Correlation Analysis Example Partial Correlation Analysis Example Multiple Correlation Analysis Example Completely Randomized Design (CRD) Example Randomized Complete Block Design (RCBD) Example Latin Square Design Example Factorial Experiment under RCBD Stability Analysis Individual Analysis of Variance for each Location Combined Analysis of Variance Additive Main Effects and Multiplicative Interaction (AMMI) Analysis Additive Main Effects and Multiplicative Interaction (AMMI) Biplot Analysis Genotype plus Genotypes by Environment (GGE) Interaction Biplot Analysis Introduction R is a free, open-source programming language and software environment for statistical computing, bioinformatics, visualization and general computing.Improving Quality in Textile Industry using Six Sigma with R
Bioinformatics with R
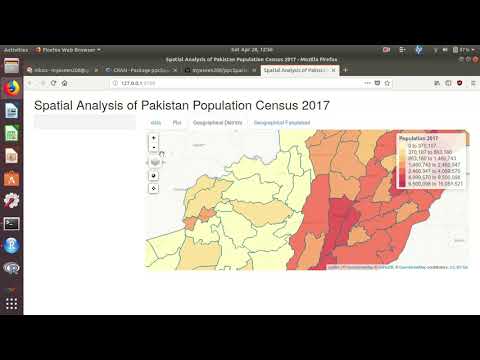
Statistics Variable Measurement Measurement Scales Nominal Data Example Example Ordinal Data Example Two Way Contingency Table Example Example Count Data Example Continuous Data Example Example Measures of Centeral Tendency Measures of Dispersion Measures of Skewness Measures of Skewness Statistics Statistics is the science of uncertainty & variability Statistics turns data into information Data -> Information -> Knowledge -> Wisdom Data Driven Decisions (3Ds) Statistics is the interpretation of Science Statistics is the Art & Science of learning from data Variable Characteristic that may vary from individual to individual Height, Weight, CGPA etc Measurement Process of assigning numbers or labels to objects or states in accordance with logically accepted rules Measurement Scales Nominal Scale: Obersvations may be classified into mutually exclusive & exhaustive classes or categories Ordinal Scale: Obersvations may be ranked Interval Scale: Difference between obersvations is meaningful Ratio Scale: Ratio between obersvations is meaningful & true zero point Nominal Data Example The following data shows the gender of a sample of twenty students from the University of Agriculture, Faisalabad.Spatial Analysis of Pakistan Population Census 2017
The latest version of the ppcSpatial package for R is now on CRAN. It performs spatial analysis for exploration of Pakistan Population Census 2017 (http://www.pbscensus.gov.pk/). It uses data from R package PakPC2017.
The Spatial map is
and full view is here.
A video showing some functionality of the package is
An introduction to R for Agricultural Research
Introduction Regression Analysis Simple Linear Regression Example Example Example Multiple Linear Regression Example Polynomial Regression Analysis Example Analysis of Variance (ANOVA) Example Example Analysis of Covariance (ANCOVA) Example Same intercepts but different slopes Different intercepts and different slopes Correlation Analysis Simple Correlation Analysis Example Partial Correlation Analysis Example Multiple Correlation Analysis Example Completely Randomized Design (CRD) Example Randomized Complete Block Design (RCBD) Example Latin Square Design Example Introduction R is a free, open-source programming language and software environment for statistical computing, bioinformatics, visualization and general computing.ppcSpatial: Spatial Analysis of Pakistan Population Census
The latest version of the ppcSpatial package for R is now on CRAN. It performs spatial analysis for exploration of Pakistan Population Census 2017 (http://www.pbscensus.gov.pk/). It uses data from R package PakPC2017.
A video showing some functionality of the package is
VetResearchLMM v1.0.0 on CRAN
The latest version of the VetResearchLMM package for R is now on CRAN. This package provides R Codes and Datasets for Duchateau, L. and Janssen, P. and Rowlands, G. J. (1998). Linear Mixed Models. An Introduction with applications in Veterinary Research. International Livestock Research Institute. The latest version of the package is prepare for new version of lmerTest.