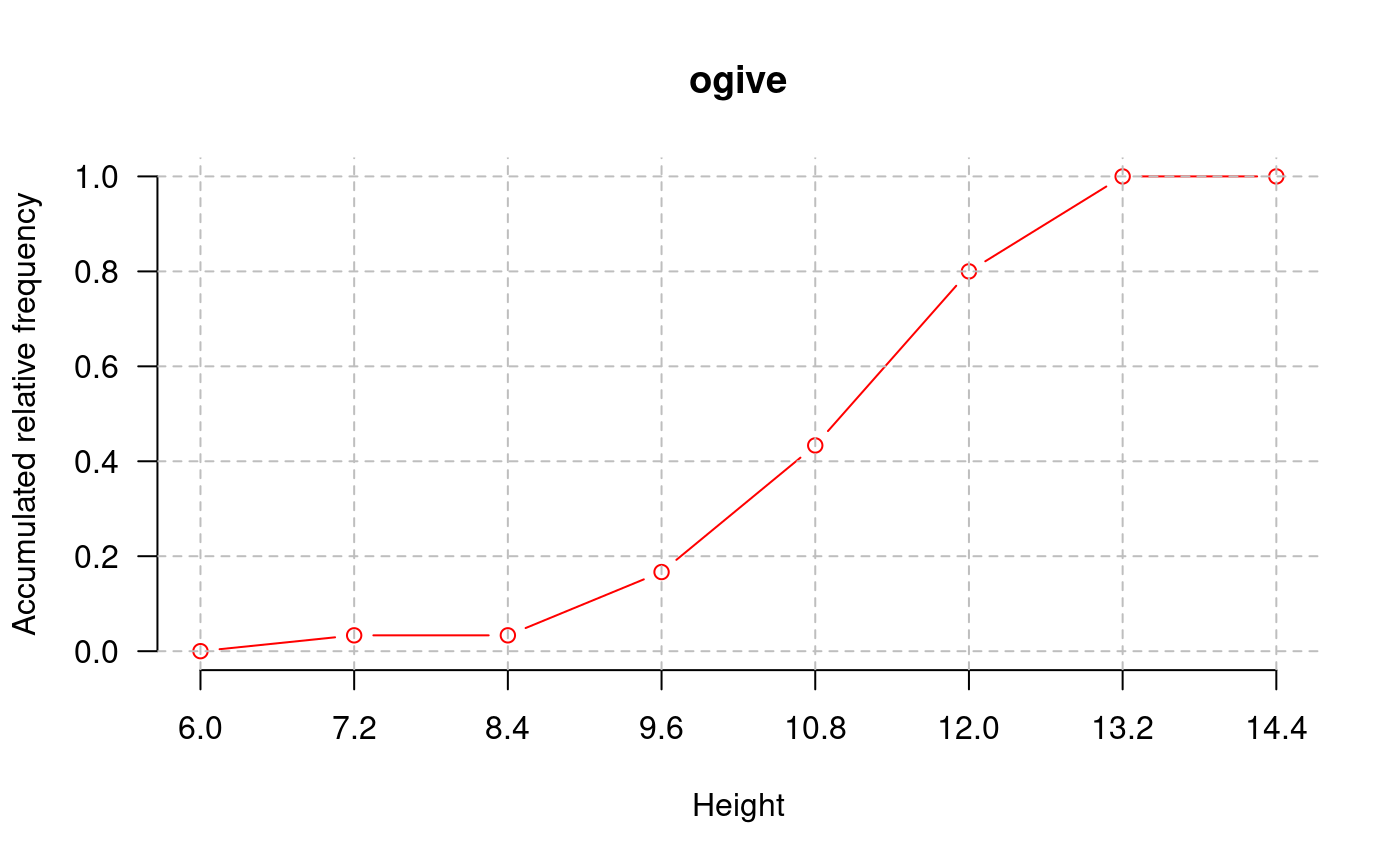
It plots the cumulative relative .frequencies with the intervals of classes defined in the histogram.
ogive.freq(histogram, type = "", xlab = "", ylab = "", axes = "", las = 1, ...)
Arguments
| histogram | object created by the function hist() or graph.freq() |
|---|---|
| type | what type of plot should be drawn. See plot() |
| xlab | x labels |
| ylab | y labels |
| axes | TRUE or FALSE |
| las | numeric in 0,1,2,3; the style of axis labels. see plot() |
| ... | Parameters of the plot() |
Value
Ogive points.
See also
polygon.freq, table.freq,
stat.freq, intervals.freq,
sturges.freq, join.freq,
graph.freq, normal.freq
Examples
library(agricolae) data(growth) h<-graph.freq(growth$height,plot=FALSE) points<-ogive.freq(h,col="red",frame=FALSE, xlab="Height", ylab="Accumulated relative frequency", main="ogive")