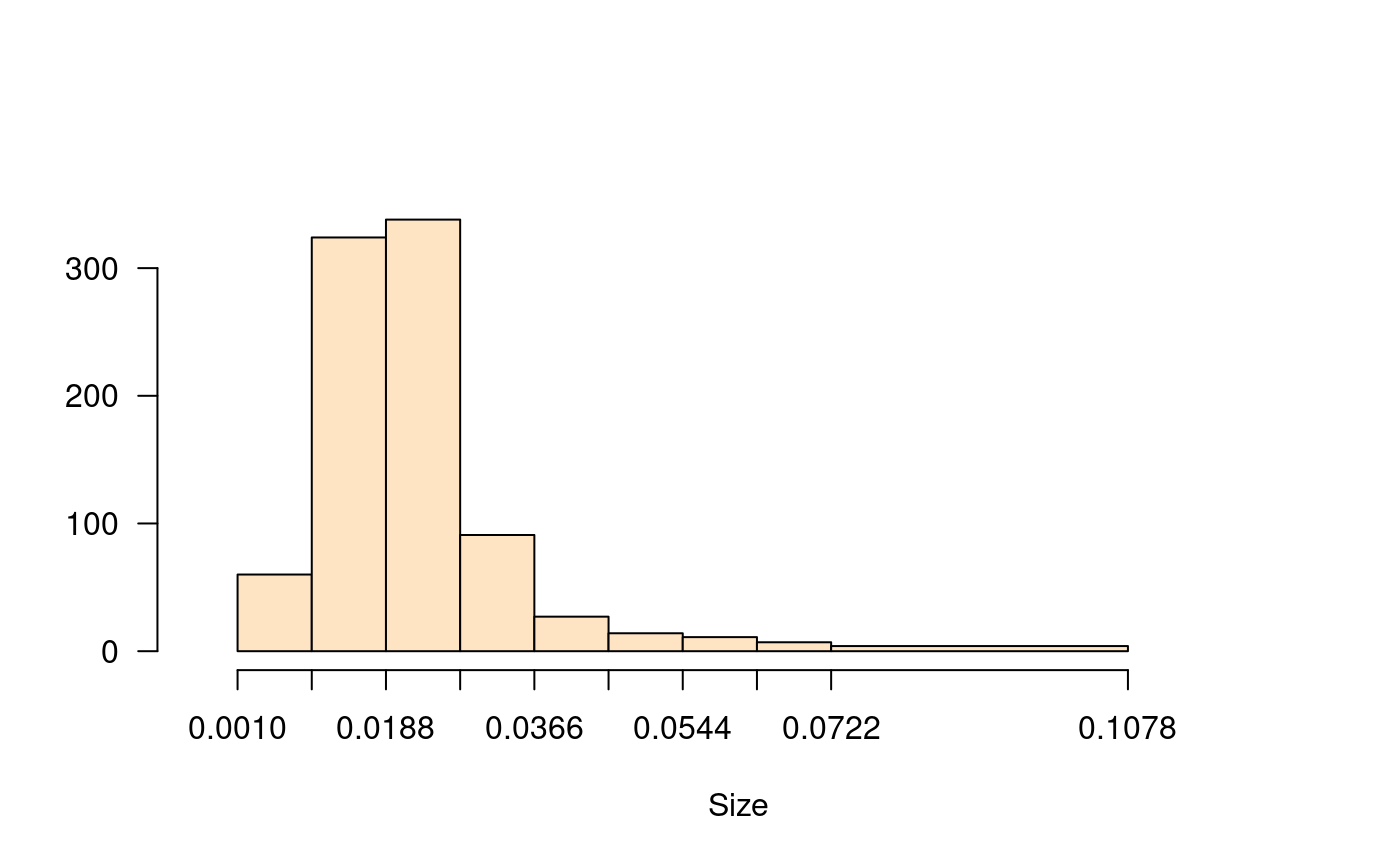
In many situations it is required to join classes because of the low .frequency in the intervals. In this process, it is required to join the intervals and ad the .frequencies of them.
join.freq(histogram, join)
Arguments
| histogram | Class graph.freq |
|---|---|
| join | vector |
Value
New histogram with union of classes.
See also
polygon.freq, table.freq,
stat.freq, intervals.freq,
sturges.freq, graph.freq,
ogive.freq, normal.freq
Examples
library(agricolae) data(natives) # histogram h1<-graph.freq(natives$size,plot=FALSE) round(table.freq(h1),4)#> Lower Upper Main Frequency Percentage CF CPF #> 1 0.0010 0.0099 0.0054 60 6.8 60 6.8 #> 2 0.0099 0.0188 0.0144 324 37.0 384 43.8 #> 3 0.0188 0.0277 0.0232 338 38.6 722 82.4 #> 4 0.0277 0.0366 0.0322 91 10.4 813 92.8 #> 5 0.0366 0.0455 0.0411 27 3.1 840 95.9 #> 6 0.0455 0.0544 0.0500 14 1.6 854 97.5 #> 7 0.0544 0.0633 0.0589 11 1.3 865 98.7 #> 8 0.0633 0.0722 0.0678 7 0.8 872 99.5 #> 9 0.0722 0.0811 0.0766 2 0.2 874 99.8 #> 10 0.0811 0.0900 0.0856 0 0.0 874 99.8 #> 11 0.0900 0.0989 0.0945 1 0.1 875 99.9 #> 12 0.0989 0.1078 0.1033 1 0.1 876 100.0# Join classes 9, 10,11 and 12 with little frequency. h2<-join.freq(h1,9:12) # new table plot(h2,col="bisque",xlab="Size")#> Lower Upper Main Frequency Percentage CF CPF #> 1 0.0010 0.0099 0.0054 60 6.8 60 6.8 #> 2 0.0099 0.0188 0.0144 324 37.0 384 43.8 #> 3 0.0188 0.0277 0.0232 338 38.6 722 82.4 #> 4 0.0277 0.0366 0.0322 91 10.4 813 92.8 #> 5 0.0366 0.0455 0.0411 27 3.1 840 95.9 #> 6 0.0455 0.0544 0.0500 14 1.6 854 97.5 #> 7 0.0544 0.0633 0.0589 11 1.3 865 98.7 #> 8 0.0633 0.0722 0.0678 7 0.8 872 99.5 #> 9 0.0722 0.1078 0.0900 4 0.5 876 100.0
