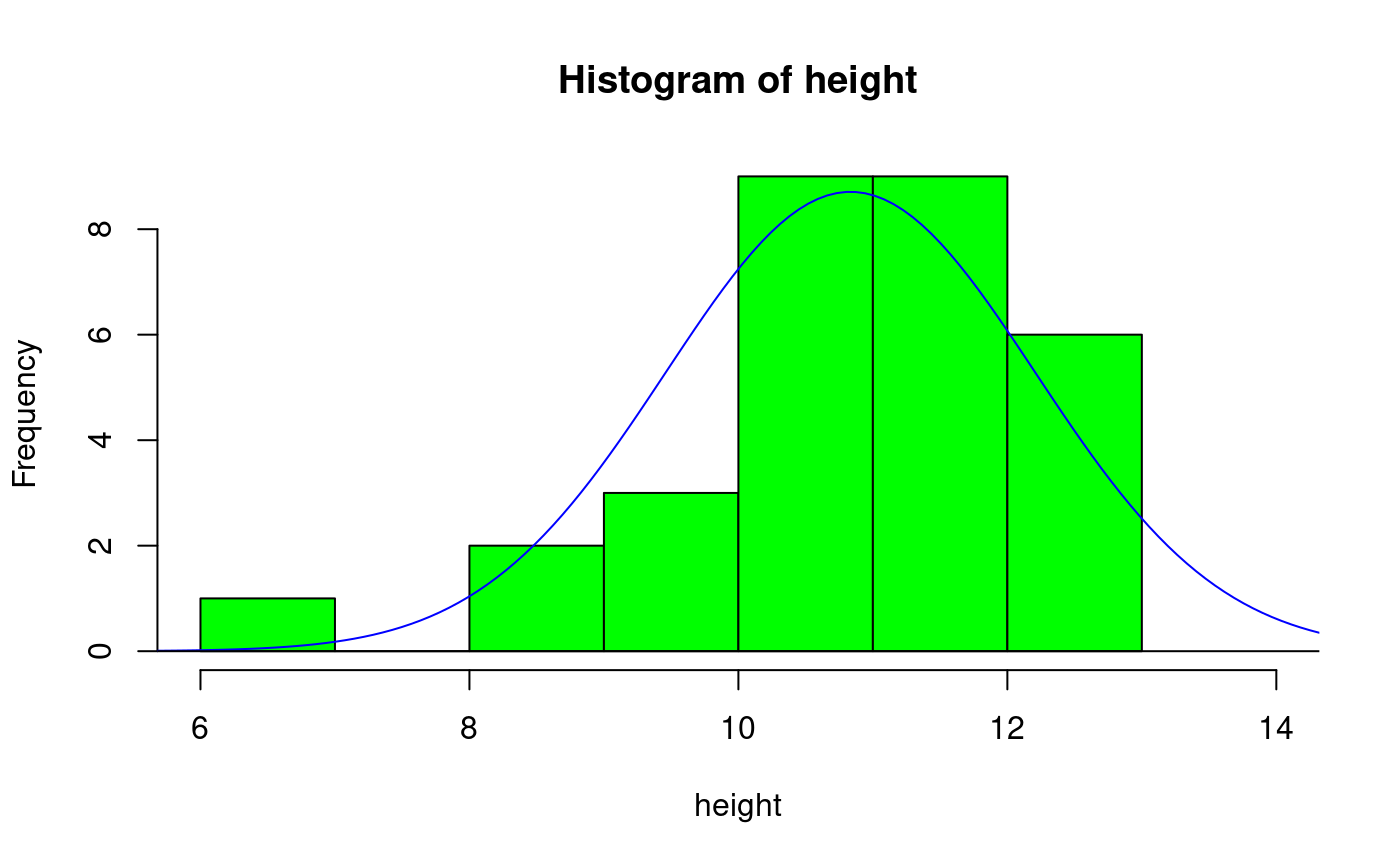
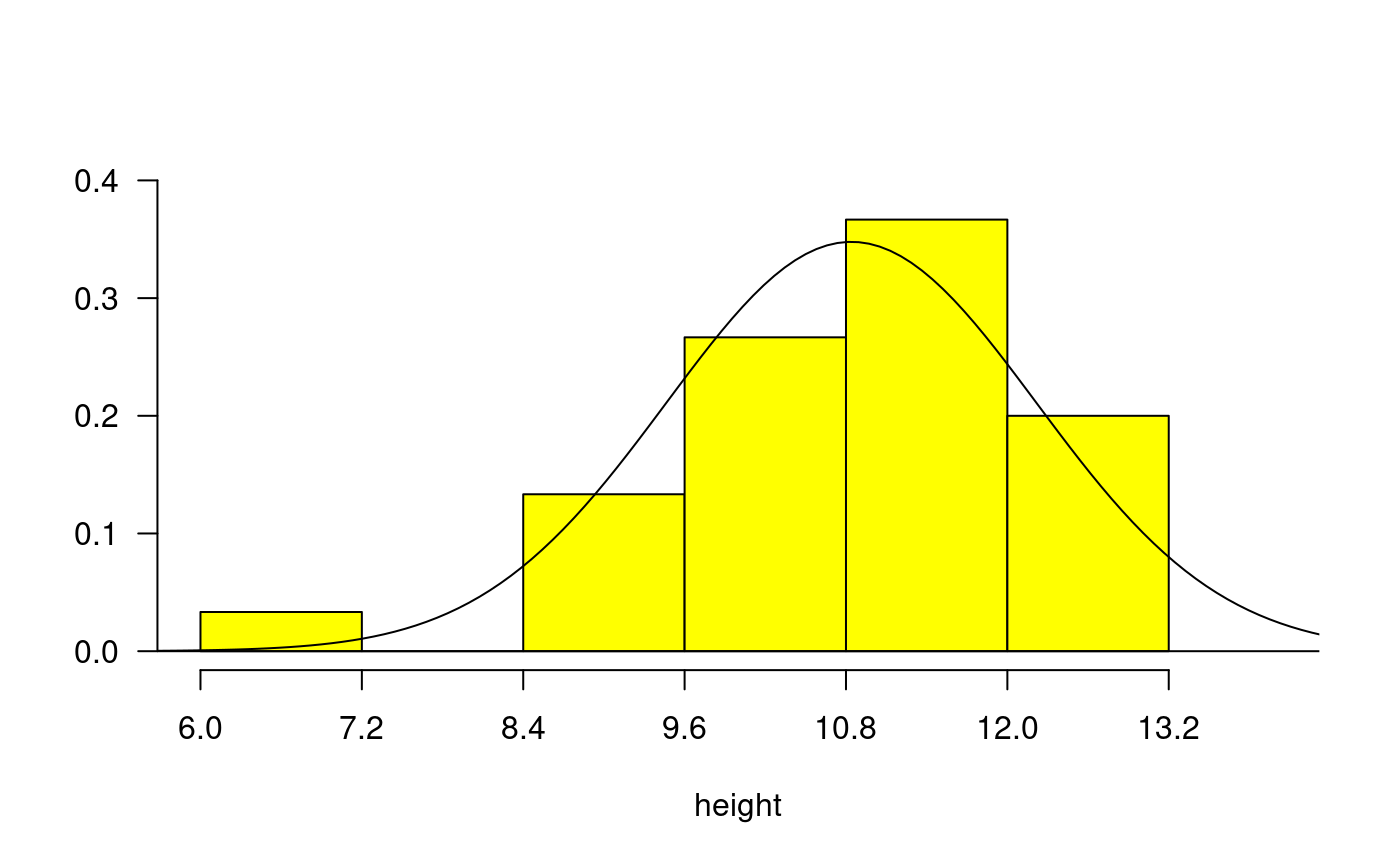
A normal distribution graph elaborated from the histogram previously constructed. The average and variance are obtained from the data grouped in the histogram.
normal.freq(histogram, frequency = 1, ...)
Arguments
| histogram | object constructed by the function hist |
|---|---|
| frequency | 1=counts, 2=relative, 3=density |
| ... | Other parameters of the function hist |
See also
polygon.freq, table.freq,
stat.freq, intervals.freq,
sturges.freq, join.freq,
ogive.freq, graph.freq
Examples
normal.freq(h1,col="blue")normal.freq(h2,frequency=2)#endgraph