A field trial was planted to compare a seedlot derived from a seed orchard (SO) with one collected from a routine plantation (P). There were eight plots of each seedlot, thinned at seven years of age. Tree diameters at breast height (dbh) were measured at 15 years and plot means calculated.
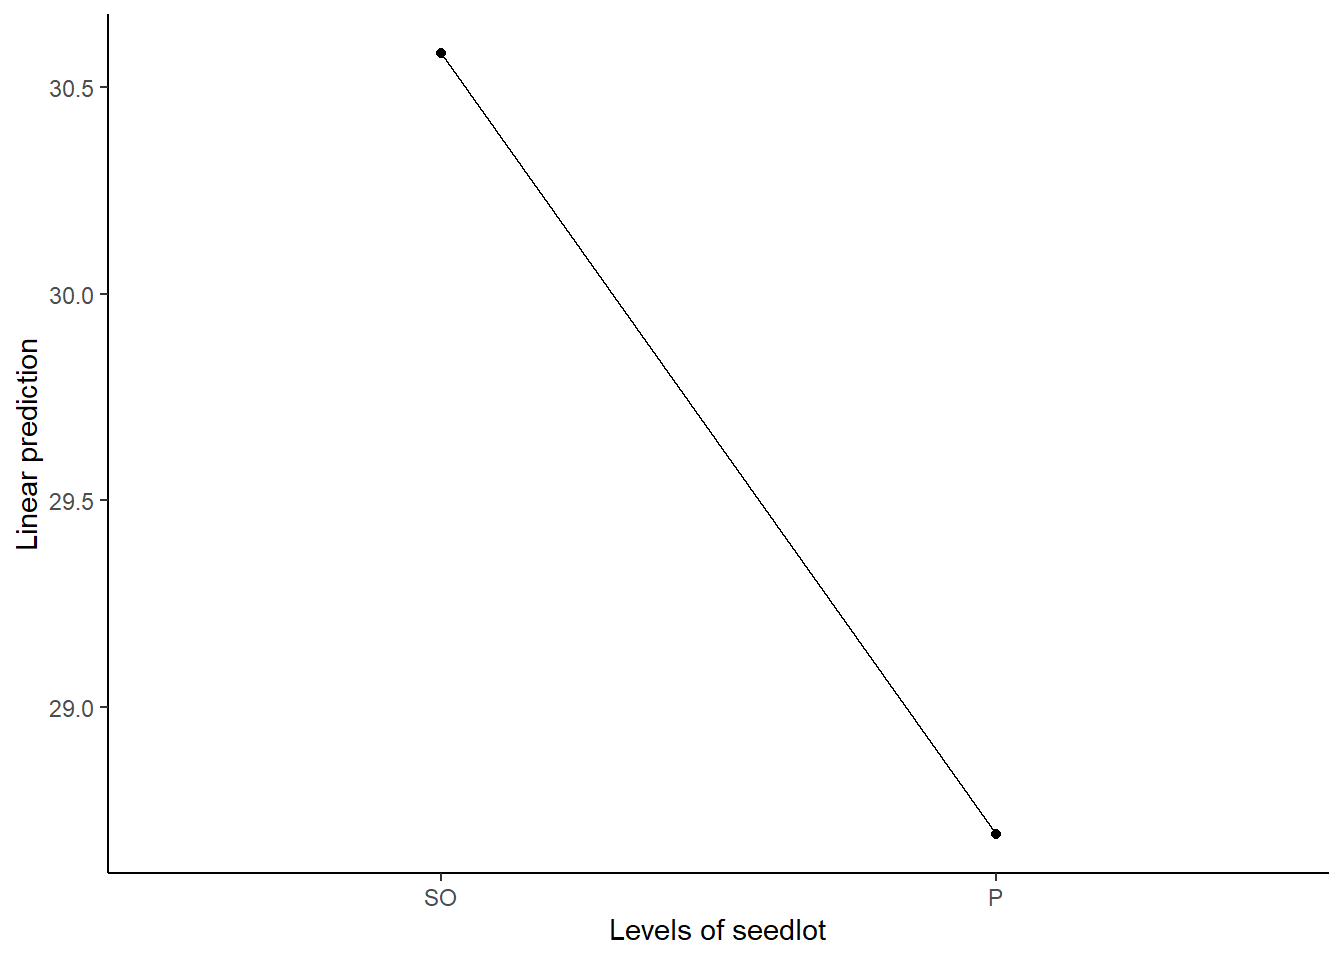
library(car)library(dae)library(dplyr)library(emmeans)library(ggplot2)library(lmerTest)library(magrittr)library(predictmeans)data(DataExam2.1)# Pg. 22 fmtab2.3<-lm(formula = dbh ~ seedlot, data = DataExam2.1)# Pg. 23anova(fmtab2.3)Analysis of Variance TableResponse: dbh Df Sum Sq Mean Sq F value Pr(>F) seedlot 114.2714.26953.25310.09284 .Residuals 1461.414.3864---Signif. codes:0'***'0.001'**'0.01'*'0.05'.'0.1' '1# Pg. 23emmeans(object = fmtab2.3, specs =~ seedlot) seedlot emmean SE df lower.CL upper.CL SO 30.60.741429.032.2 P 28.70.741427.130.3Confidence level used:0.95emmip(object = fmtab2.3, formula =~ seedlot) +theme_classic()
2.2 Example 2.2 (Pg. 26)
Example 2.2 (Pg. 26)
library(car)library(dae)library(dplyr)library(emmeans)library(ggplot2)library(lmerTest)library(magrittr)library(predictmeans)data(DataExam2.2)# Pg. 24 fmtab2.5<-lm(formula = dbh ~ block + seedlot , data = DataExam2.2 )# Pg. 26anova(fmtab2.5)Analysis of Variance TableResponse: dbh Df Sum Sq Mean Sq F value Pr(>F) block 748.8676.98103.89590.04671*seedlot 114.27014.26957.96350.02570*Residuals 712.5431.7919---Signif. codes:0'***'0.001'**'0.01'*'0.05'.'0.1' '1# Pg. 26emmeans(object = fmtab2.5, specs =~ seedlot) seedlot emmean SE df lower.CL upper.CL SO 30.60.473729.531.7 P 28.70.473727.629.8Results are averaged over the levels of: block Confidence level used:0.95emmip(object = fmtab2.5, formula =~ seedlot) +theme_classic()