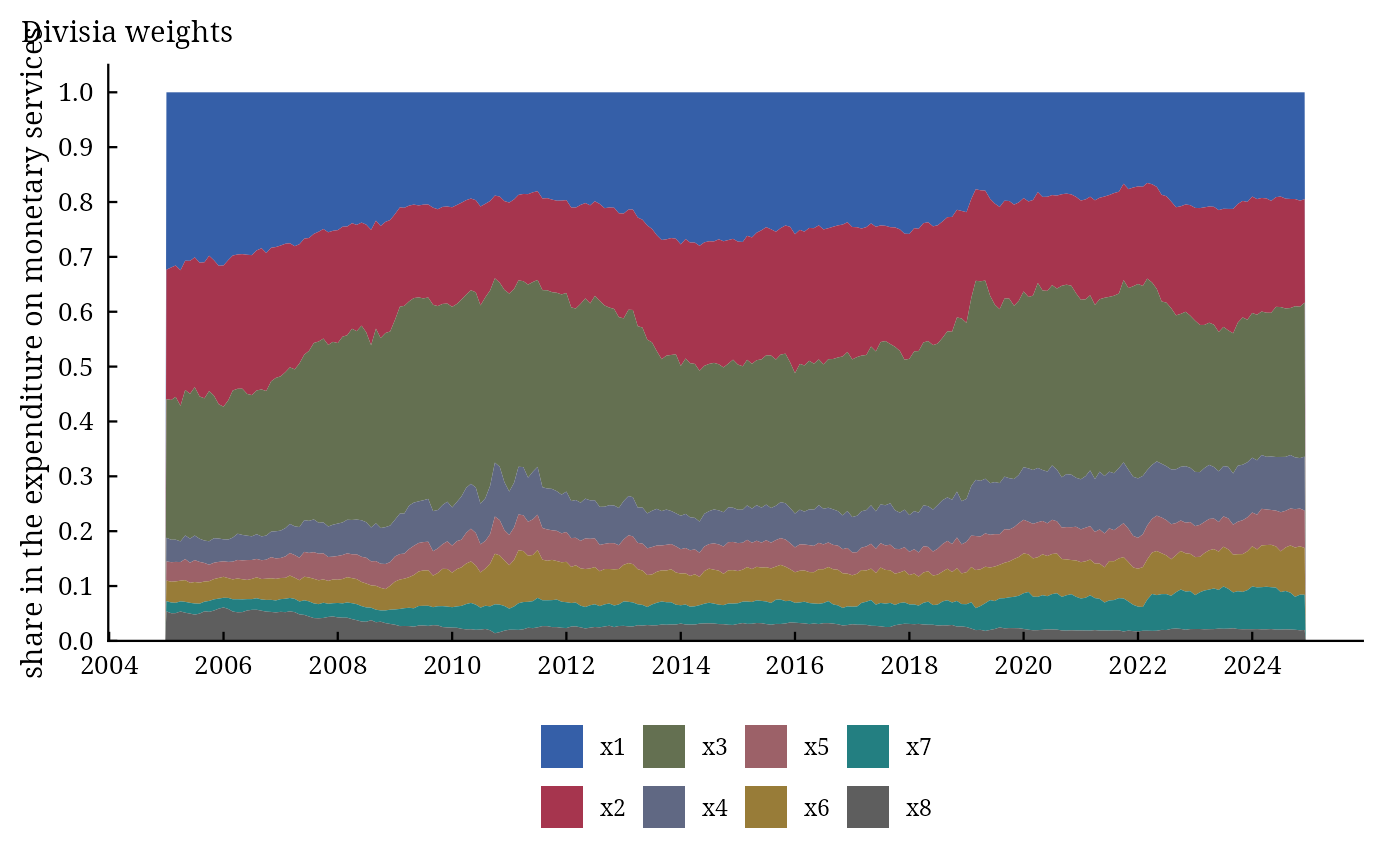
autoplot() methods for the results of dmai; plot() draws the same figures.
Arguments
- object
a result of
dmai(..., as_dt = FALSE),dmai_compare(),dmai_user_cost()ordmai_moments().- which
the figure: for
dmai()results"index"(default, with the simple sum),"growth","shares","user_cost","moments"or"price"; fordmai_compare()"index"or"growth"; fordmai_user_cost()"shares"or"user_cost".- ...
not used.
Author
Muhammad Yaseen (myaseen208@gmail.com)