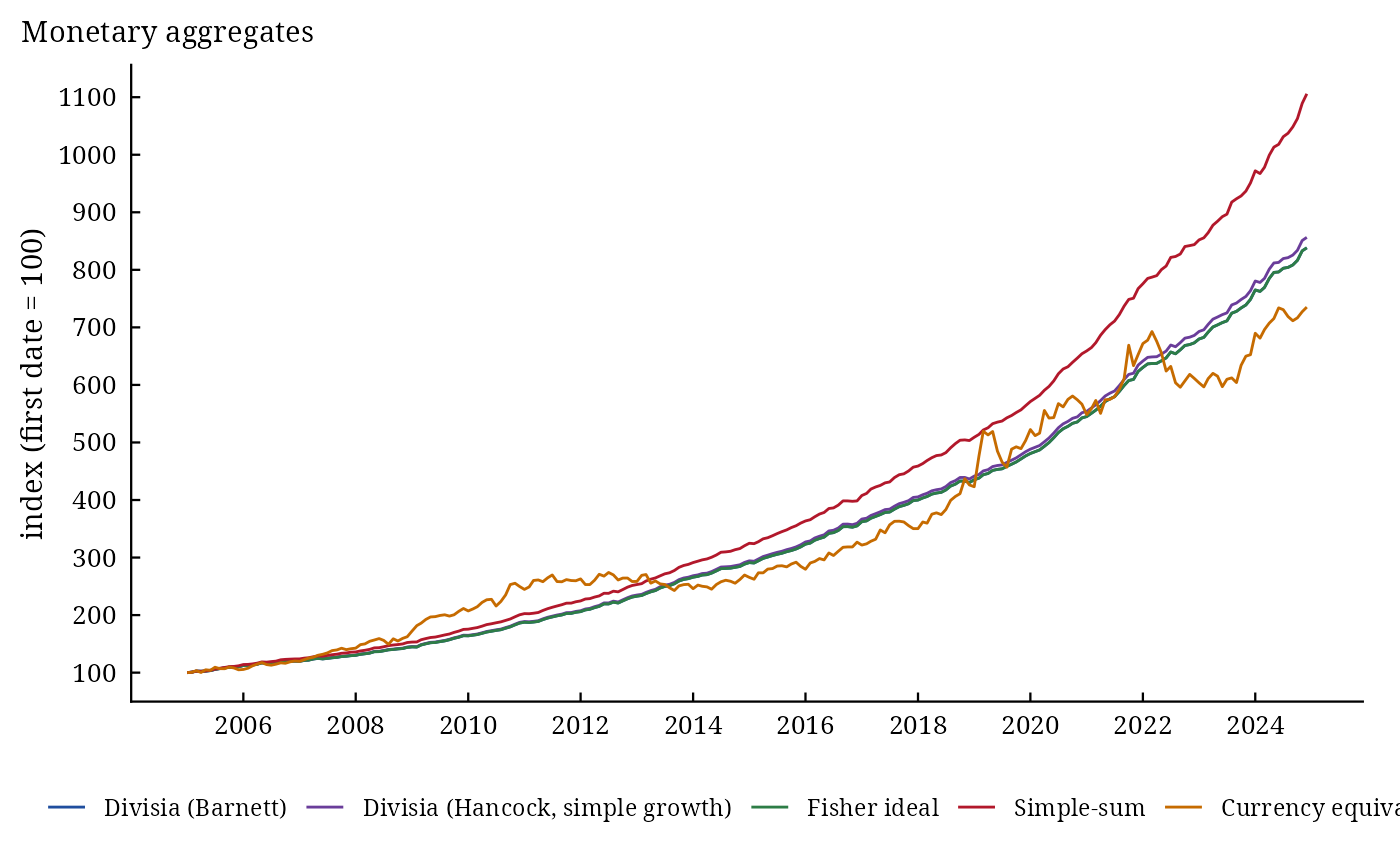
dmai_compare() computes the Divisia (Barnett and Hancock), Fisher ideal, simple-sum and currency
equivalent aggregates of the same data, as indexes equal to base at the first date, with their growth
rates and average annual growth.
Usage
dmai_compare(
  .data,
  methods = c("Barnett", "Hancock", "Fisher", "SimpleSum", "CE"),
  logbase = NULL,
  date = "Date",
  x = NULL,
  r = NULL,
  user_cost = NULL,
  benchmark = NULL,
  percent = TRUE,
  base = 100
)

# Default S3 method
dmai_compare(
  .data,
  methods = c("Barnett", "Hancock", "Fisher", "SimpleSum", "CE"),
  logbase = NULL,
  date = "Date",
  x = NULL,
  r = NULL,
  user_cost = NULL,
  benchmark = NULL,
  percent = TRUE,
  base = 100
)
Arguments
- .data
a data frame with one row per date: a date column and, for every component, a quantity column and a rate column (named
x1,x2, ... andr1,r2, ... unlessxandrare given).- methods
the methods to compare (default: all five;
"CE"is dropped when no rates are given).- logbase
base of the logarithm of the growth
DMAIof the"Barnett","Fisher","SimpleSum"and"CE"indexes;NULL(default) for the natural logarithm. Version 0.5.0 used base 10 by default;logbase = 10reproduces it.- date
name of the date column (default
"Date").- x
names of the quantity columns (default
NULL:x1,x2, ...).- r
names of the rate columns, in the order of
x(defaultNULL:r1,r2, ...).- user_cost
names of columns that give the user costs directly, in the order of
x(defaultNULL: computed from the rates). The rates are then needed only for"CE".- benchmark
the benchmark rate:
NULL(default, the largest component rate), a column name, a number or one value per row of.data, in the units of the rates.- percent
logical; are the rates in percent (default
TRUE) or decimal?- base
value of the index at the first date (default 100).
Value
An object of class c("dmai_compare", "dmai_result", "list"): indexes (a long
data.table: date, method, index, growth), summary (by method: average growth per period and per
year, standard deviation of growth, last index value) and settings. plot() draws the indexes or
their growth (which = "growth").
References
Barnett, W. A. (1980). Economic monetary aggregates: an application of index number and aggregation theory. Journal of Econometrics, 14(1), 11–48. doi:10.1016/0304-4076(80)90070-6
See also
Other dmai analyses:
dmai(),
dmai_moments(),
dmai_user_cost()
Author
Muhammad Yaseen (myaseen208@gmail.com)
Examples
data(money_sim)
cmp <-
  dmai_compare(
      .data     = money_sim
    , methods   = c("Barnett", "Hancock", "Fisher", "SimpleSum", "CE")
    , logbase   = NULL
    , date      = "Date"
    , x         = NULL
    , r         = NULL
    , user_cost = NULL
    , benchmark = "rb"
    , percent   = TRUE
    , base      = 100
    )
cmp
#> 5 monetary aggregates of 8 components, 240 dates
#> ================================================
#>       method mean_growth annual_growth sd_growth last_index
#>       <fctr>       <num>         <num>     <num>      <num>
#> 1:   Barnett      0.8896         11.27    0.5902      838.3
#> 2:   Hancock      0.9044         11.39    0.5954      856.4
#> 3:    Fisher      0.8896         11.27    0.5902      838.2
#> 4: SimpleSum      1.0055         12.82    0.5726     1105.9
#> 5:        CE      0.8347         10.54    2.6930      735.2
#>
#> Sources: Barnett (1978); Barnett (1980); Hancock (1985); Fisher (1922); Diewert
#> (1976); Rotemberg et al. (1995). Full references: dmai_cite(x).
plot(x = cmp)