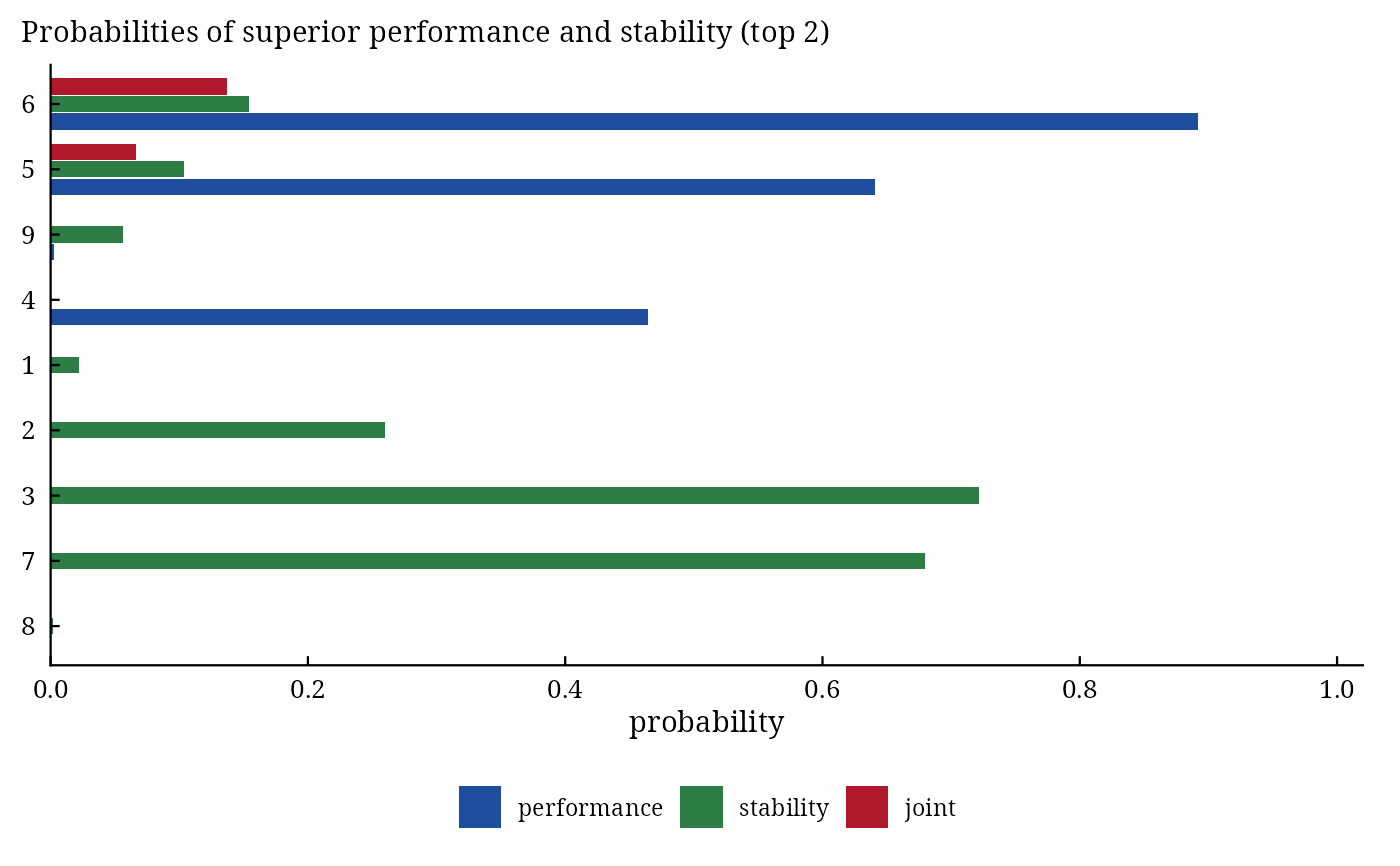
bam_superiority() computes the probabilities of Dias et al. (2022) for recommending cultivars: the
probability that a genotype is among the best selected fraction across environments and within each environment,
the probability that it is among the most stable, their joint probability, and pairwise probabilities that one
genotype outperforms or is more stable than another.
Arguments
- fit
a result of
bayes_ammi()orbayes_stability()(bam_stability()needsbayes_ammi()).- .s
selection intensity: the proportion of genotypes selected (default 0.2).
- higher_better
TRUE(default) when larger values of the trait are better.
Value
An object of class c("bam_superiority", "bam_result", "list"):
marginaldata.tablesorted by the joint probability:Gen,mean(posterior mean of the marginal value),prob_performance,prob_stability,prob_joint.conditionalmatrix \(G \times E\): probability of superior performance in every environment.
pairwise_performance,pairwise_stabilitymatrices \(G \times G\): entry \((i, i')\) is the probability that row genotype \(i\) is better (more stable) than \(i'\).
Methods: print(), plot() (which = c("marginal", "conditional", "pairwise")),
bam_interpret().
Details
With \(\Omega^{(s)}\) the \(\lceil sG \rceil\) genotypes with the best marginal values
\(\bar{\eta}^{(s)}_{i\cdot}\) in draw \(s\) (selection intensity \(s\) = .s),
$$P^{\mathrm{perf}}_i = \Pr(i \in \Omega \mid \mathbf{y}), \qquad P^{\mathrm{perf}}_{ij} = \Pr(i \in
\Omega_j \mid \mathbf{y}),$$
where \(\Omega_j\) selects on \(\eta_{ij}\) within environment \(j\). Stability is the
variance over environments of the interaction effects \(ge_{ij} = \eta_{ij} - \bar{\eta}_{i\cdot} -
\bar{\eta}_{\cdot j} + \bar{\eta}_{\cdot\cdot}\) (Shukla 1972):
\(P^{\mathrm{stab}}_i\) is the probability that genotype \(i\) is among the
\(\lceil sG \rceil\) genotypes with the smallest variance, and the joint probability is
\(P^{\mathrm{perf}}_i P^{\mathrm{stab}}_i\), as in Dias et al. (2022). Pairwise,
\(\Pr(\bar{\eta}_{i\cdot} > \bar{\eta}_{i'\cdot} \mid \mathbf{y})\) and
\(\Pr(\mathrm{var}_i < \mathrm{var}_{i'} \mid \mathbf{y})\).
References
Dias, K. O. G., dos Santos, J. P. R., Krause, M. D., Piepho, H.-P., Guimaraes, L. J. M., Pastina, M. M. and Garcia, A. A. F. (2022). Leveraging probability concepts for cultivar recommendation in multi-environment trials. Theoretical and Applied Genetics. doi:10.1007/s00122-022-04041-y
Shukla, G. K. (1972). Some statistical aspects of partitioning genotype-environmental components of variability. Heredity, 29(2), 237–245. doi:10.1038/hdy.1972.87
See also
bam_winners, bam_ranks, bam_stability
Other decisions:
bam_predict(),
bam_ranks(),
bam_stability(),
bam_winners()
Author
Muhammad Yaseen (myaseen208@gmail.com)
Examples
data(Maiz)
fit <-
  bayes_ammi(
      .data   = Maiz
    , .y      = y
    , .gen    = entry
    , .env    = site
    , .rep    = rep
    , .nIter  = 1000
    , .k      = 2
    , .burnin = 200
    , .thin   = 1
    , .chains = 1
    , .priors = bam_priors(
          mu_mean     = 0
        , mu_var      = 1e+8
        , tau_mean    = 0
        , tau_var     = 1e+8
        , delta_mean  = 0
        , delta_var   = 1e+8
        , lambda_mean = 0
        , lambda_var  = 1e+8
        , nu          = 1
        , s2          = NULL
        )
    , .level  = 0.95
    , .seed   = 1
    , .align  = TRUE
    , .model  = "AMMI"
    , .het    = FALSE
    , .waic   = TRUE
    )
sp <-
  bam_superiority(
      fit           = fit
    , .s            = 0.2
    , higher_better = TRUE
    )
sp$marginal
#>       Gen     mean prob_performance prob_stability prob_joint
#>    <char>    <num>            <num>          <num>      <num>
#> 1:      6 5331.927            0.892          0.154   0.137368
#> 2:      5 5248.385            0.641          0.104   0.066664
#> 3:      9 4924.780            0.003          0.056   0.000168
#> 4:      4 5219.423            0.464          0.000   0.000000
#> 5:      1 4613.857            0.000          0.022   0.000000
#> 6:      2 4606.430            0.000          0.260   0.000000
#> 7:      3 4822.457            0.000          0.722   0.000000
#> 8:      7 4665.152            0.000          0.680   0.000000
#> 9:      8 4285.844            0.000          0.002   0.000000
plot(x = sp, which = "marginal")