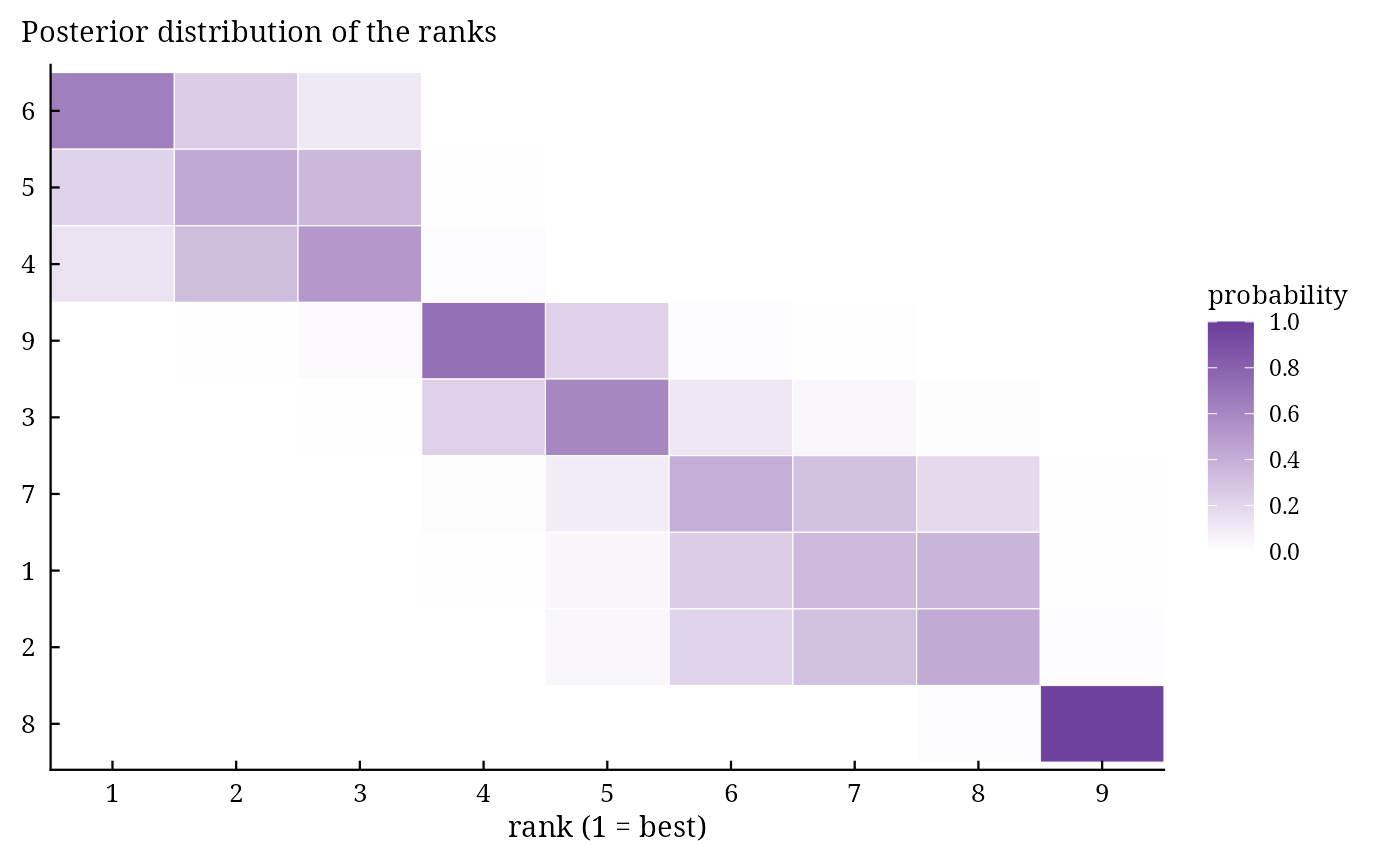
bam_ranks() gives the posterior probability that each genotype takes each rank, by its mean over the
environments (the marginal value) or within one environment, with the expected rank and its HPD interval.
Arguments
- fit
a result of
bayes_ammi()orbayes_stability()(bam_stability()needsbayes_ammi()).- higher_better
TRUE(default) when larger values of the trait are better.- .env
NULL(default: marginal values) or the label of an environment.
Value
An object of class c("bam_ranks", "bam_result", "list"): probabilities (matrix genotypes x
ranks) and summary (data.table: Gen, mean_rank, median_rank, lower,
upper of the HPD interval of the rank, prob_first).
Methods: print(), plot(), bam_interpret().
Details
In draw \(s\) the genotypes are ranked by \(\bar{\eta}^{(s)}_{i\cdot}\) (1 = best); the probability of rank \(r\) is the share of draws in which genotype \(i\) takes it. Ranks summarise the uncertainty of a selection decision better than intervals of the means, since they account for all the genotypes jointly.
References
Dias, K. O. G., dos Santos, J. P. R., Krause, M. D., Piepho, H.-P., Guimaraes, L. J. M., Pastina, M. M. and Garcia, A. A. F. (2022). Leveraging probability concepts for cultivar recommendation in multi-environment trials. Theoretical and Applied Genetics. doi:10.1007/s00122-022-04041-y
See also
Other decisions:
bam_predict(),
bam_stability(),
bam_superiority(),
bam_winners()
Author
Muhammad Yaseen (myaseen208@gmail.com)
Examples
data(Maiz)
fit <-
  bayes_ammi(
      .data   = Maiz
    , .y      = y
    , .gen    = entry
    , .env    = site
    , .rep    = rep
    , .nIter  = 1000
    , .k      = 2
    , .burnin = 200
    , .thin   = 1
    , .chains = 1
    , .priors = bam_priors(
          mu_mean     = 0
        , mu_var      = 1e+8
        , tau_mean    = 0
        , tau_var     = 1e+8
        , delta_mean  = 0
        , delta_var   = 1e+8
        , lambda_mean = 0
        , lambda_var  = 1e+8
        , nu          = 1
        , s2          = NULL
        )
    , .level  = 0.95
    , .seed   = 1
    , .align  = TRUE
    , .model  = "AMMI"
    , .het    = FALSE
    , .waic   = TRUE
    )
rk <-
  bam_ranks(
      fit           = fit
    , higher_better = TRUE
    , .env          = NULL
    )
rk$summary
#>       Gen mean_rank median_rank lower upper prob_first
#>    <char>     <num>       <num> <num> <num>      <num>
#> 1:      6     1.464           1     1     3      0.645
#> 2:      5     2.153           2     1     3      0.215
#> 3:      4     2.417           3     1     3      0.140
#> 4:      9     4.247           4     4     5      0.000
#> 5:      3     4.998           5     3     6      0.000
#> 6:      7     6.553           6     5     8      0.000
#> 7:      1     7.037           7     5     8      0.000
#> 8:      2     7.154           7     5     8      0.000
#> 9:      8     8.977           9     9     9      0.000
plot(x = rk)