LATEBLIGHT is a mathematical model that simulates the effect of weather, host growth and resistance, and fungicide use on asexual development and growth of Phytophthora infestans on potato foliage.
lateblight(
  WS,
  Cultivar,
  ApplSys,
  InocDate,
  LGR,
  IniSpor,
  SR,
  IE,
  LP,
  InMicCol,
  MatTime = c("EARLYSEASON", "MIDSEASON", "LATESEASON"),
  ...
)
Arguments
| WS | object weather-severity |
|---|---|
| Cultivar | chr |
| ApplSys | chr |
| InocDate | days |
| LGR | num, see example |
| IniSpor | num |
| SR | num, see example |
| IE | num, Initialization infection |
| LP | num, latent period |
| InMicCol | num |
| MatTime | chr |
| ... | plot graphics parameters |
Value
"Date","nday","MicCol","SimSeverity",...
"dates","nday","MeanSeverity","StDevSeverity"
Details
LATEBLIGHT Version LB2004 was created in October 2004 (Andrade-Piedra et al., 2005a, b and c), based on the C-version written by B.E. Ticknor ('BET 21191 modification of cbm8d29.c'), reported by Doster et al. (1990) and described in detail by Fry et al. (1991) (This version is referred as LB1990 by Andrade-Piedra et al. [2005a]). The first version of LATEBLIGHT was developed by Bruhn and Fry (1981) and described in detail by Bruhn et al. (1980).
Note
All format data for date is yyyy-mm,dd, for example "2000-04-22". change with function as.Date()
References
Andrade-Piedra, J. L., Hijmans, R. J., Forbes, G. A., Fry, W.
E., and Nelson, R. J. 2005a. Simulation of potato late blight in the Andes.
I: Modification and parameterization of the LATEBLIGHT model. Phytopathology
95:1191-1199.
Andrade-Piedra, J. L., Hijmans, R. J., Juarez, H. S.,
Forbes, G. A., Shtienberg, D., and Fry, W. E. 2005b. Simulation of potato
late blight in the Andes. II: Validation of the LATEBLIGHT model.
Phytopathology 95:1200-1208.
Andrade-Piedra, J. L., Forbes, G. A.,
Shtienberg, D., Grunwald, N. J., Chacon, M. G., Taipe, M. V., Hijmans, R.
J., and Fry, W. E. 2005c. Qualification of a plant disease simulation model:
Performance of the LATEBLIGHT model across a broad range of environments.
Phytopathology 95:1412-1422.
Bruhn, J.A., Bruck, R.I., Fry, W.E.,
Arneson, P.A., and Keokosky, E.V. 1980. User's manual for LATEBLIGHT: a
plant disease management game. Cornell University, Department of Plant
Pathology, Ithaca, NY, USA. Mimeo 80-1.
Bruhn, J.A., and Fry, W.E. 1981.
Analysis of potato late blight epidemiology by simulation modeling.
Phytopathology 71:612-616.
Doster, M. A., Milgroom, M. G., and Fry, W. E.
1990. Quantification of factors influencing potato late blight suppression
and selection for metalaxyl resistance in Phytophthora infestans - A
simulation approach. Phytopathology 80:1190-1198.
Fry, W.E., Milgroom,
M.G., Doster, M.A., Bruhn, J.A., and Bruck, R.I. 1991. LATEBLIGHT: a plant
disease management game - User Manual. Version 3.1. Microsoft Windows
Adaptation by B. E. Ticknor, and P. A. Arneson. Ithaca, Cornell University,
Department of Plant Pathology, Ithaca, NY, USA.
See also
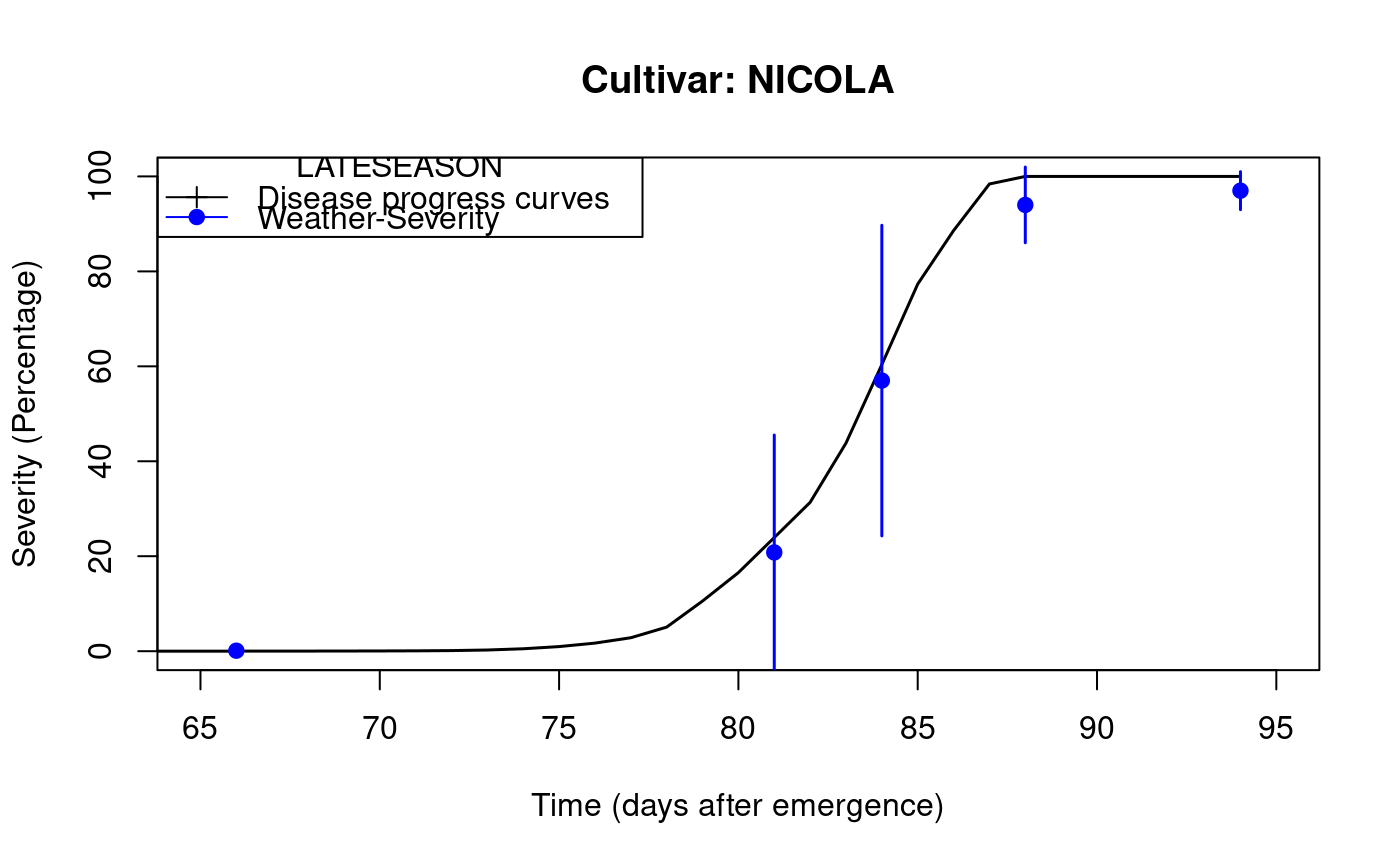
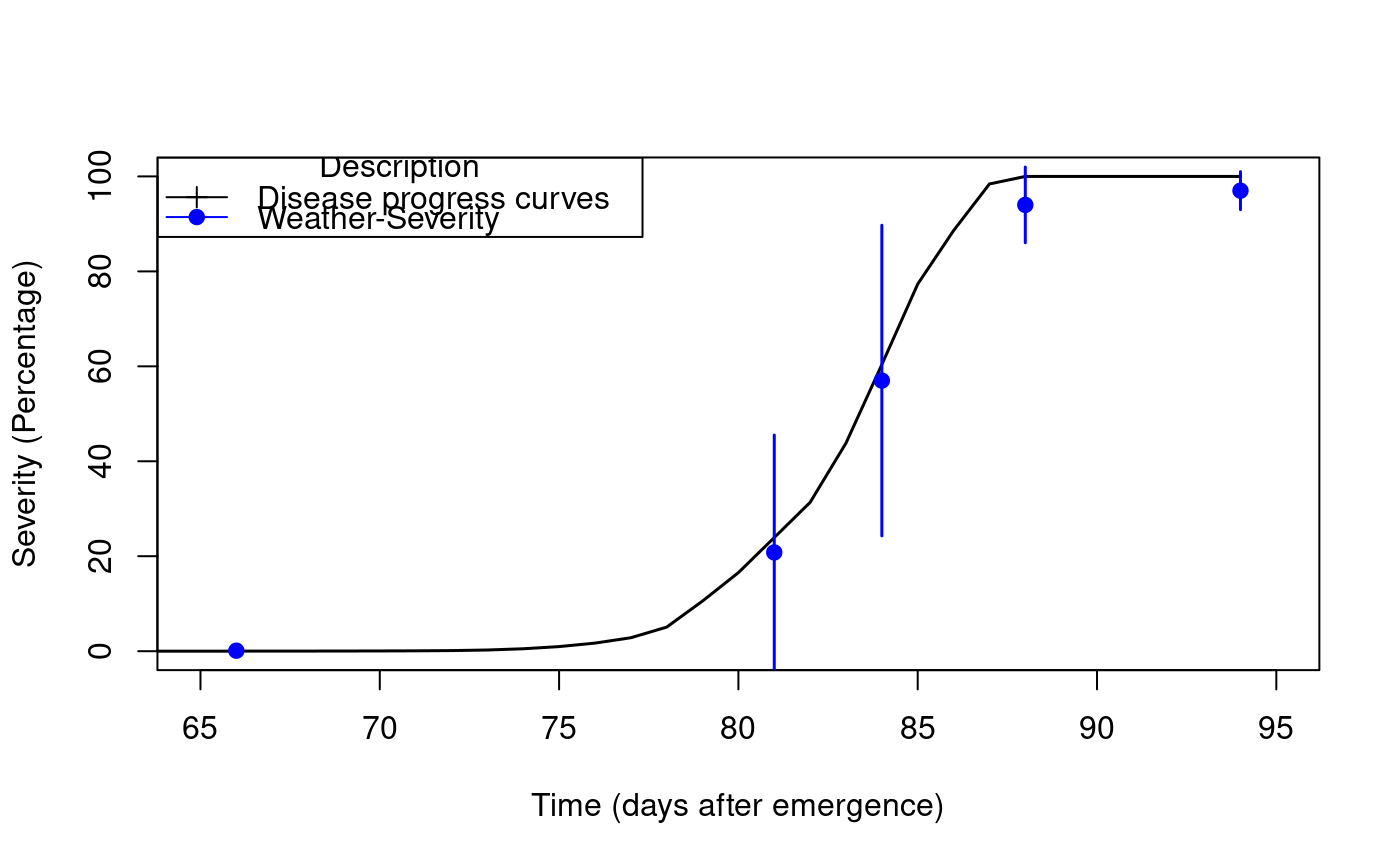
Examples
library(agricolae) f <- system.file("external/weather.csv", package="agricolae") weather <- read.csv(f,header=FALSE) f <- system.file("external/severity.csv", package="agricolae") severity <- read.csv(f) weather[,1]<-as.Date(weather[,1],format = "%m/%d/%Y") # Parameters dates dates<-c("2000-03-25","2000-04-09","2000-04-12","2000-04-16","2000-04-22") dates<-as.Date(dates) EmergDate <- as.Date('2000/01/19') EndEpidDate <- as.Date("2000-04-22") dates<-as.Date(dates) NoReadingsH<- 1 RHthreshold <- 90 WS<-weatherSeverity(weather,severity,dates,EmergDate,EndEpidDate, NoReadingsH,RHthreshold) # Parameters Lateblight InocDate<-"2000-03-18" LGR <- 0.00410 IniSpor <- 0 SR <- 292000000 IE <- 1.0 LP <- 2.82 InMicCol <- 9 Cultivar <- 'NICOLA' ApplSys <- "NOFUNGICIDE" main<-"Cultivar: NICOLA" #-------------------------- model<-lateblight(WS, Cultivar,ApplSys, InocDate, LGR,IniSpor,SR,IE, LP, MatTime='LATESEASON',InMicCol,main=main,type="l",xlim=c(65,95),lwd=1.5, xlab="Time (days after emergence)", ylab="Severity (Percentage)")# reproduce graph x<- model$Ofile$nday y<- model$Ofile$SimSeverity w<- model$Gfile$nday z<- model$Gfile$MeanSeverity Min<-model$Gfile$MinObs Max<-model$Gfile$MaxObs plot(x,y,type="l",xlim=c(65,95),lwd=1.5,xlab="Time (days after emergence)", ylab="Severity (Percentage)")legend("topleft",c("Disease progress curves","Weather-Severity"), title="Description",lty=1,pch=c(3,19),col=c("black","blue"))