A better estimate of disease progress is the area under the disease progress stairs (AUDPS). The AUDPS approach improves the estimation of disease progress by giving a weight closer to optimal to the first and last observations.
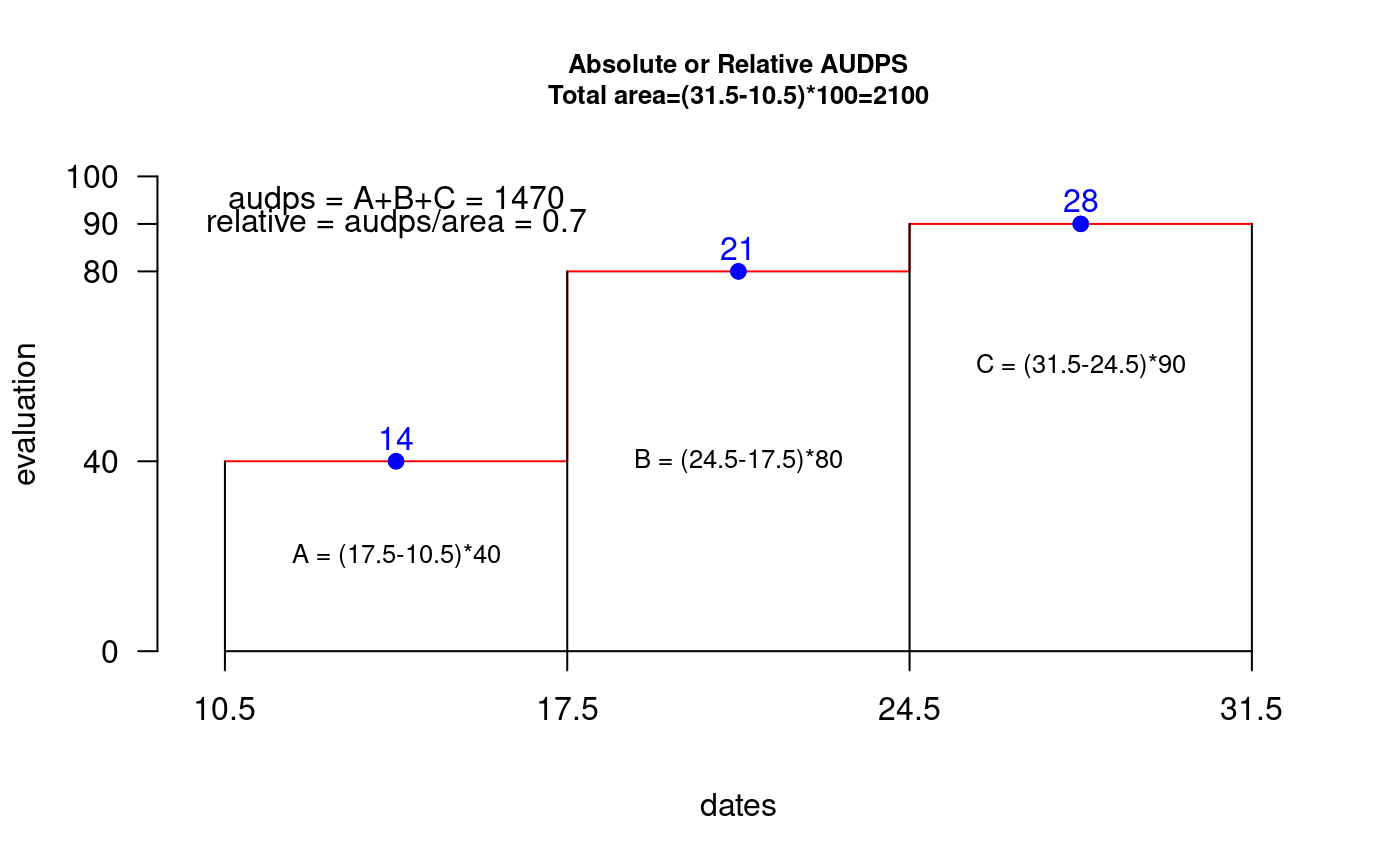
AUDPS. For the illustration one considers three evaluations (14, 21 and 28 days) and percentage of damage in the plant 40, 80 and 90 (interval between dates of evaluation 7 days). AUDPS = 1470. The evaluations can be at different interval. AUDPS= sum( rectangle area by interval in times evaluation ) see example.
audps(evaluation, dates, type = "absolute")

# S3 method for default
audps(evaluation, dates, type = "absolute")
Arguments
| evaluation | Table of data of the evaluations: Data frame |
|---|---|
| dates | Vector of dates corresponding to each evaluation |
| type | relative, absolute |
Value
Vector with relative or absolute audps.
References
Ivan Simko, and Hans-Peter Piepho, (2012). The area under the disease progress stairs: Calculation, advantage, and application. Phytopathology 102:381- 389.
Examples
library(agricolae) dates<-c(14,21,28) # days # example 1: evaluation - vector evaluation<-c(40,80,90) audps(evaluation,dates)#> evaluation #> 1470audps(evaluation,dates,"relative")#> evaluation #> 0.7x<-seq(10.5,31.5,7) y<-c(40,80,90,90) plot(x,y,"s",ylim=c(0,100),xlim=c(10,32),axes=FALSE,col="red" ,ylab="",xlab="")title(cex.main=0.8,main="Absolute or Relative AUDPS\nTotal area=(31.5-10.5)*100=2100", ylab="evaluation",xlab="dates" )#> evaluation #> 1470