2 + 2
5 - 2
5 * 2
6/21 Statistics and the Scientific Method
1.1 Motivation
Quotation (William E. Deming)
In God we trust, all others must bring data.
Quotation (H.G. Wells)
Statistical thinking will one day be as necessary a qualification for efficient citizenship as the ability to read & write.
Quotation (R. A. Fisher)
To call in the statistician after the experiment is done may be no more than asking him to perform a postmortem examination: he may be able to say what the experiment died of.
1.2 Introduction
- Statistics is the science concerned with using sample information to make inference about populations.
- Statistics is the science of uncertainty and variability.
- Statistics is the interpretation of Science
- Data Driven Decisions (3Ds)
1.3 Reasoning
- Deduction
- Reasoning from general to particular.
- Man is mortal. → Every human being is mortal.
- Induction
- Reasoning from particular to general.
1.4 Statistical Reasoning & Analysis
- Statistics is the science of uncertainty & variability
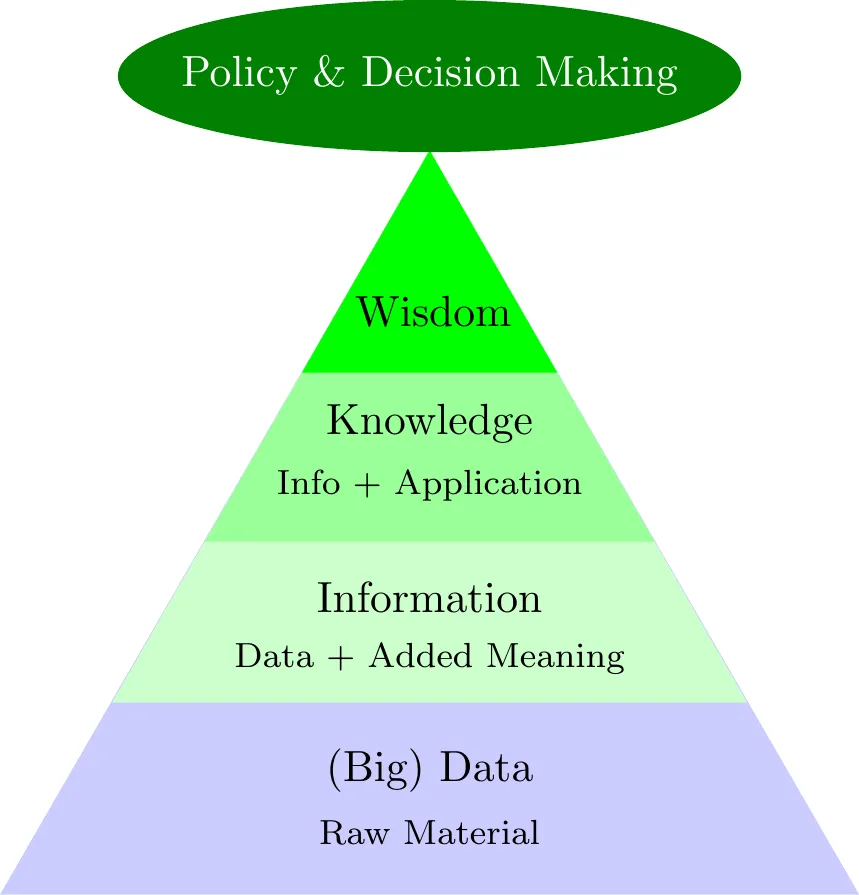
- Turning Data into Information
- Data → Information → Knowledge → Wisdom
- Statistics is the Art and Science of learning from Data.
1.5 Definitions
- Population
- Set of measurements of interest. Characteristics of the population (parameters) are typically of interest.
- Sample
- Subset of measurements of interest. A characteristic of the sample (statistic) is used to infer population characteristics (parameters).
- Parameter
- A characteristic of the population.
- Statistic
- A characteristic of the sample.
- Descriptive Statistics
- Describing the important characteristics of a set of data.
- Inferential Statistics
- Using sample data to make inferences (or generalizations) about a population.
- Statistical Inference
- Making a statement about the population (parameter) based on the sample (statistic).
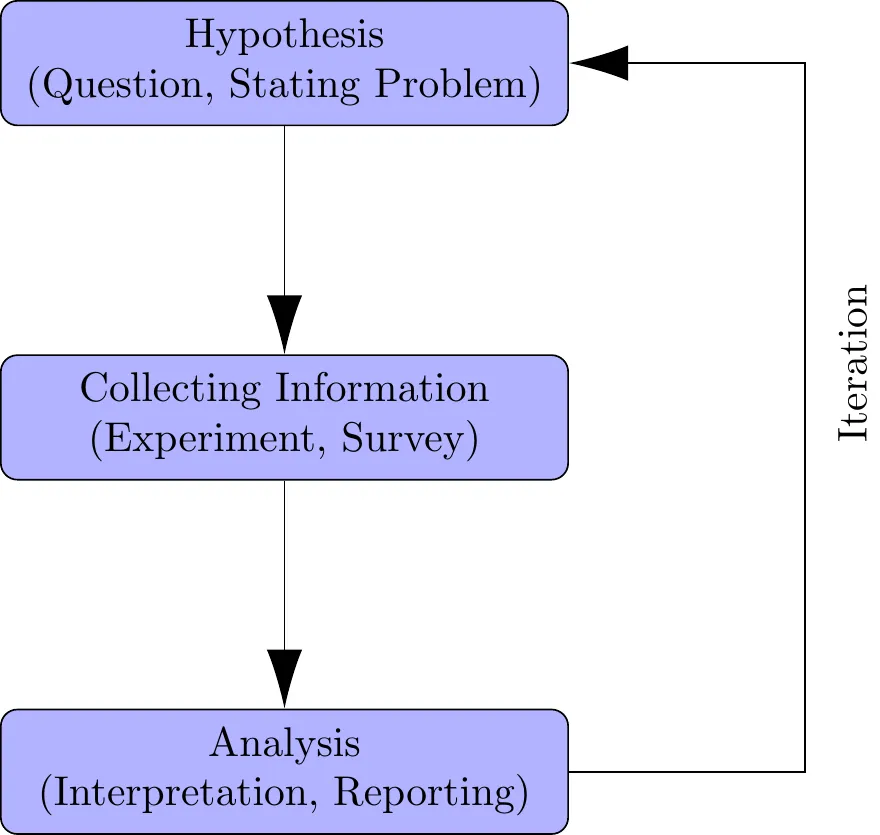
1.6 Scientific Method and Statistics
1.7 Statistical Data Generating Mechanism
1.7.1 Observational Study/Survey
Researcher has (no control) over conditions of interest.
1.7.2 Experiment
Researcher has (control) over some conditions of interest.
1.8 Variable
- A characteristic that may vary from subject to subject
- Height, Weight, Income, Eye color, Gender, etc
- Variables are denoted by last English alphabets in upper case
- X, Y, Z, etc
- Different observations of a variable are characterized by subscripts
- X_{1},X_{2},\ldots,X_{n}, etc
1.9 Measurement & Measurement Scales
- Measurement
- The process of assigning numbers or labels to objects or states in accordance with specific logically accepted rules.
- Measurement Scales
- Data can be classified according to levels of measurement.
- The level of measurement of the data often dictates the calculations that can be done to summarize and present the data.
- It will also determine the statistical tests that should be performed.
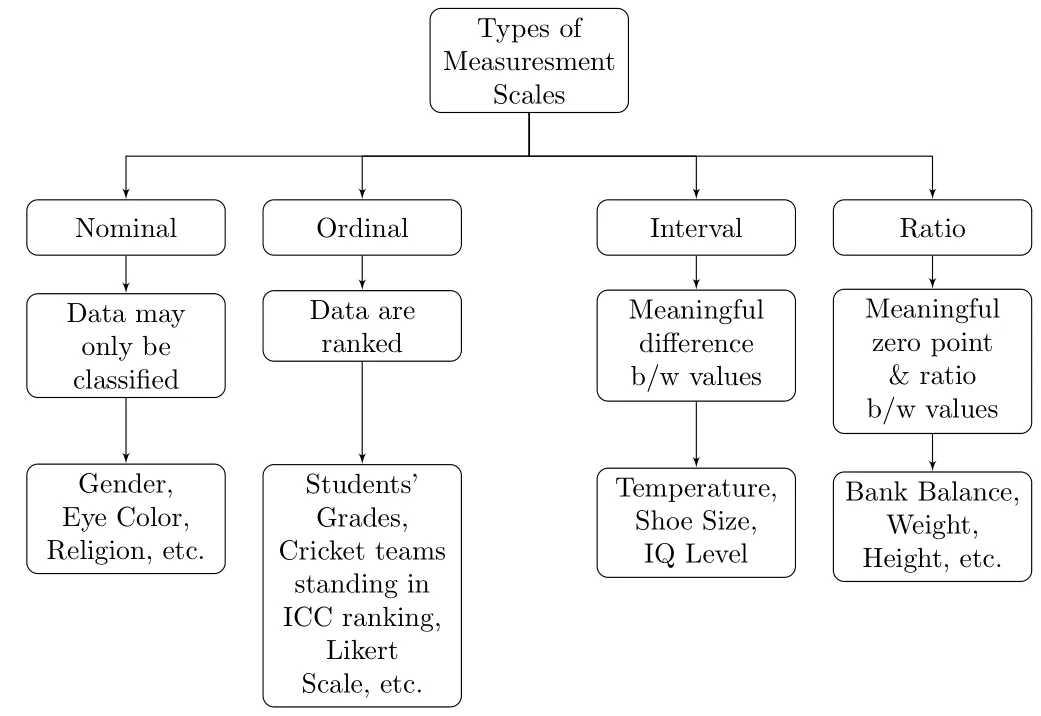
1.10 Types of Variables
1.10.1 Qualitative & Quantitative Variables
- Qualitative
- Nominal or Ordinal variables
- Quantitative
- Interval or Ratio variables
- Discrete
- Continuous
- Normal
- Non-Normal
- Interval or Ratio variables
1.10.2 Dependent & Independent Variables
- Dependent Variable
- Variable influenced by other variable(s)
- Independent Variable
- Variable influencing other variable(s)
1.11 Relationship b/w Variables
1.11.1 Dependent & Independent Variables
- Area & Radius of a Circle
- Area of a circle is influenced by its radius.
- Dependent Variable: Area
- Independent Variable: Radius
- Area ← Radius
- Area of a circle is influenced by its radius.
- Electricity Bill & Units Consumed
- Electricity bill is influenced by units consumed.
- Dependent Variable: Electricity Bill
- Independent Variable: Units Consumed
- Electricity Bill ← Units Consumed
- Electricity bill is influenced by units consumed.
- Expenditures & Income
- Expenditures are influenced by Income.
- Dependent Variable: Expenditures
- Independent Variable: Income
- Expenditures ← Income
- Expenditures are influenced by Income.
- Crop Production & Amount of Fertilizer
- Crop Production is influenced by Amount of Fertilizer used.
- Dependent Variable: Crop Production
- Independent Variable: Amount of Fertilizer
- Crop Production ← Amount of Fertilizer
- Crop Production is influenced by Amount of Fertilizer used.
1.12 Types of Relationship
1.12.1 Mathematical Relationship
- Mathematical Relationship
- Exact Relationship
- Y = f\left(X\right)
- Y \mathrel{\color{red}\leftarrow} X
- Relationship between Area and Radius of a Circle
- A = f\left(r\right)
- A = \pi r^{2}
- A \mathrel{\color{red}\leftarrow} r
- Relationship between Electricity Bill & Units Consumed
- \text{Bill} = f\left(\text{Units Consumed}\right)
- \text{Bill} \mathrel{\color{red}\leftarrow} \text{Units Consumed}
1.13 Statistical Relationship
- Statistical Relationship
- Inexact or Probabilistic Relationship
- Y = f\left(X\right)+\epsilon
- Y \mathrel{\color{red}\leftarrow} X
- Relationship between Expenditures and Income
- \text{Expenditures} = f\left(\text{Income}\right)+\epsilon
- \text{Expenditures} \mathrel{\color{red}\leftarrow} \text{Income}
- Crop Production and Amount of Fertilizer
- \text{Crop Production} = f\left(\text{Amount of Fertilizer}\right)+\epsilon
- \text{Crop Production} \mathrel{\color{red}\leftarrow} \text{Amount of Fertilizer}
1.14 Statistical Models
George E P Box
All models are wrong, but some are useful.
1.15 Linear Model
- Expenditures & Income
- Expenditures are influenced by Income.
- Expenditures ← Income
- Expenditures & Gender
- Expenditures are influenced by Gender.
- Expenditures ← Gender
- Expenditures, Income & Gender
- Expenditures are influenced by Income & Gender.
- Expenditures ← Income + Gender
- Weight Gain & Intake
- Weight Gain is influenced by Intake.
- Weight Gain ← Intake
- Weight Gain & Feed Type
- Weight Gain is influenced by Feed Type.
- Weight Gain ← Feed Type
- Weight Gain, Intake & Feed Type
- Weight Gain is influenced by Intake & Feed Type.
- Weight Gain ← Intake + Feed Type
- Yield & Amount of Fertilizer
- Yield of a crop is influenced by Amount of Fertilizer.
- Yield ← Amount of Fertilizer
- Yield & Varieties
- Yield of a crop is influenced by Varieties.
- Yield ← Varieties
- Yield, Amount of Fertilizer & Varieties
- Yield of a crop is influenced by Amount of Fertilizer & Varieties.
- Yield ← Amount of Fertilizer + Varieties
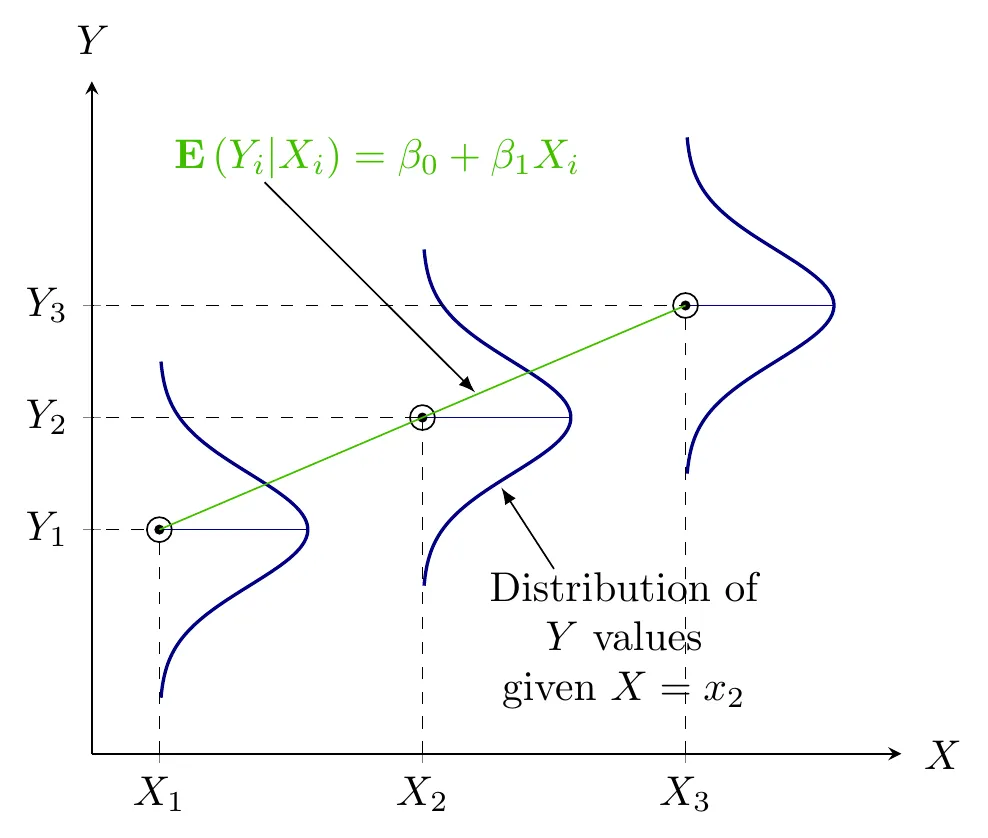
1.15.1 Regression Model
- Quantify the dependency of a Normal variable on one or more quantitative variable(s)
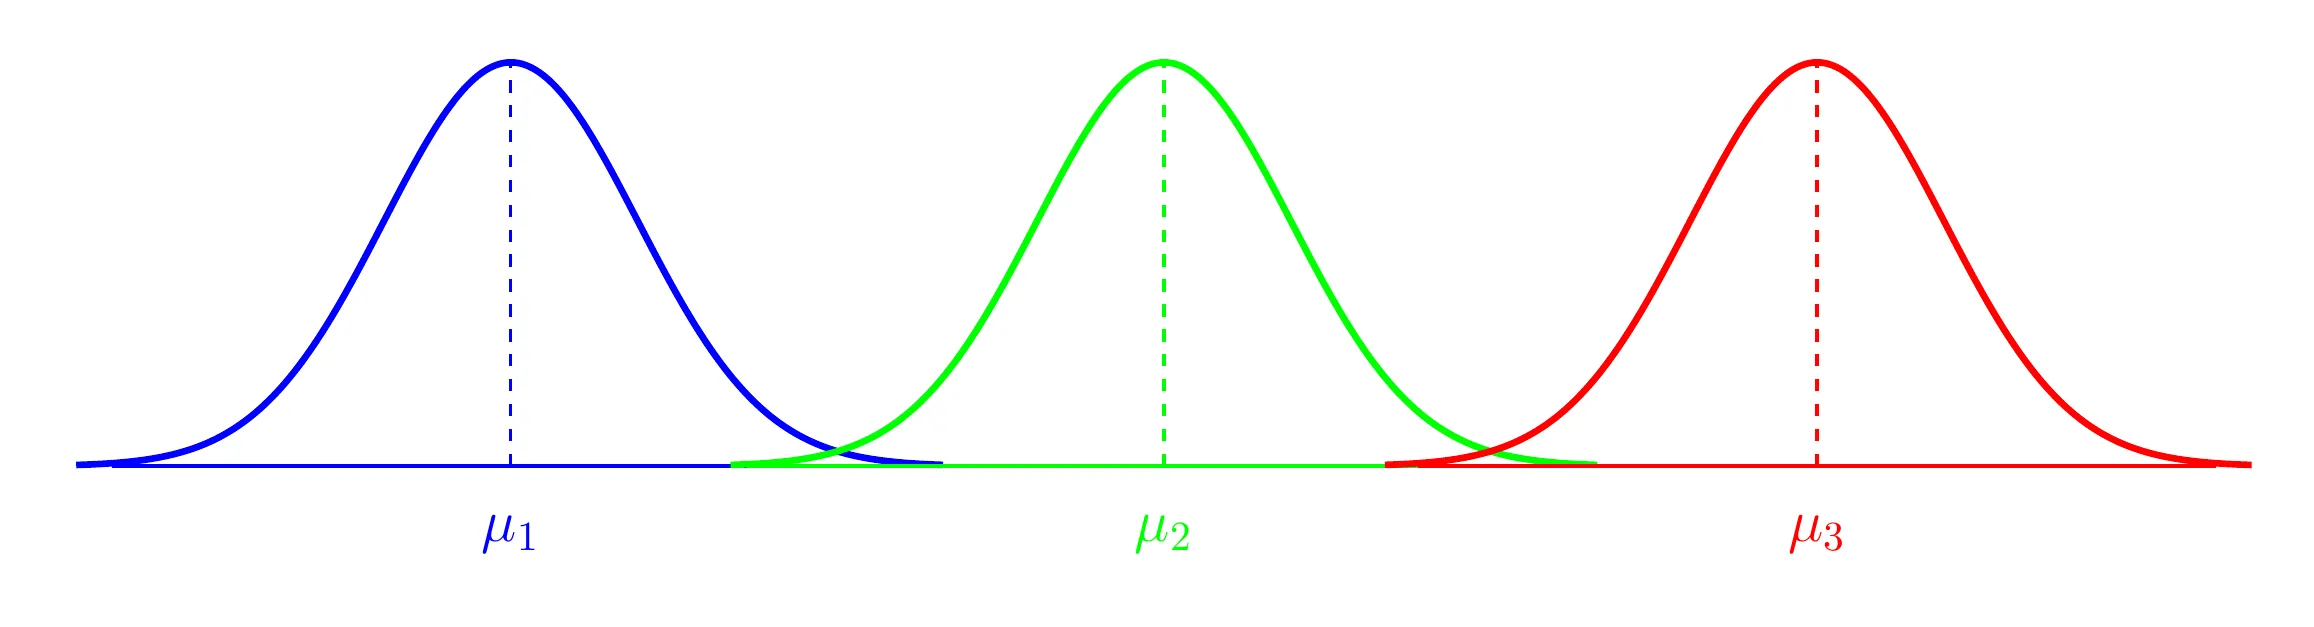
1.15.2 ANOVA Model
- Comparing means of Normal dependent variable for levels of different factors
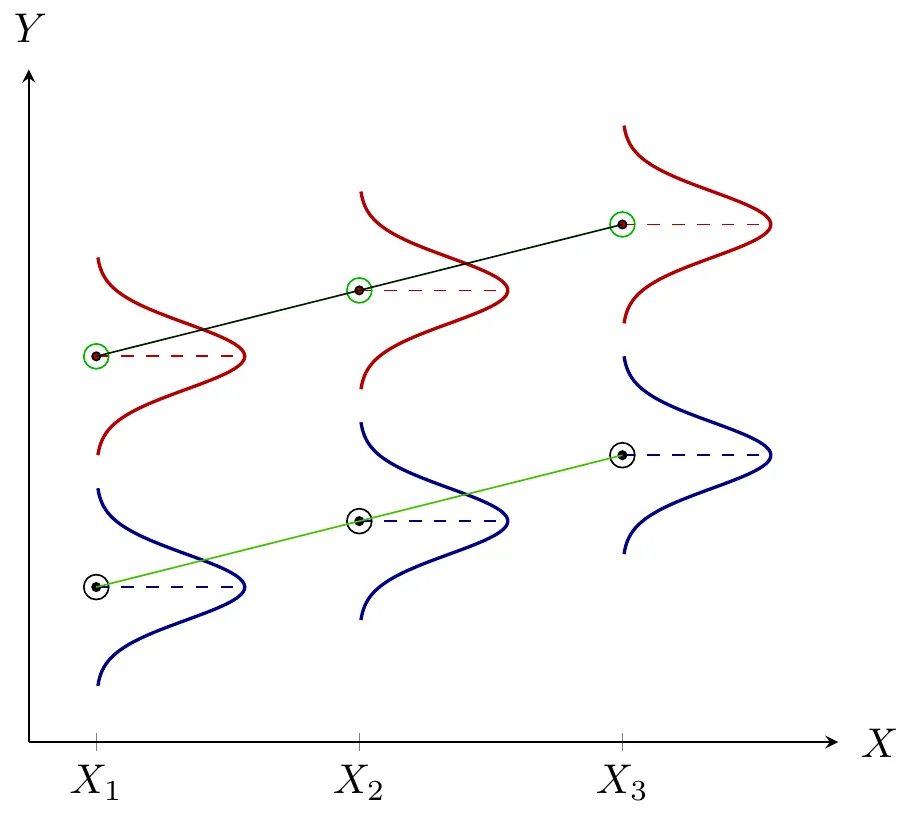
1.15.3 ANCOVA Model
- Quantify the dependency of a Normal variable on one or more quantitative variable(s)
- Comparing means of Normal dependent variable for levels of different factors
1.16 R Software
Definition
R is a free, open-source programming language and software environment for statistical computing, bioinformatics, visualization and general computing. R provides a wide variety of statistical and graphical techniques, and is highly extensible. The latest version of R can be obtained from https://cran.r-project.org/bin/.
1.16.1 RStudio
RStudio is a powerful integrated development environment (IDE) for R, and it can be downloaded from https://www.rstudio.com/products/rstudio/download/.
1.16.2 Example Code (Minimal)
---
title: "Statistics and the Scientific Method"
format:
  html
toc: true
number-sections: true
---

# Introduction

```{r}
#| echo: true
2 + 2
5 - 2
5 * 2
6/2
```