2 + 2
5 - 2
5 * 2
6/21 The Role of Statistics in Engineering

Major Themes of Stat-4110
- Basic Data Analysis: A discussion on gathering, displaying, and summarizing data
- Probability: A study of the laws of chance
- Statistical Inference: The science of drawing statistical conclusions from specific data using a knowledge of probability.
Learning Objectives
After careful study of this chapter, you should be able to do the following:
- Identify the role that statistics can play in the engineering problem-solving process.
- Discuss how variability affects data collected and used in making decisions.
- Discuss the methods that engineers use to collect data.
- Explain the importance of random samples.
- Identify the advantages of designed experiments in data collection.
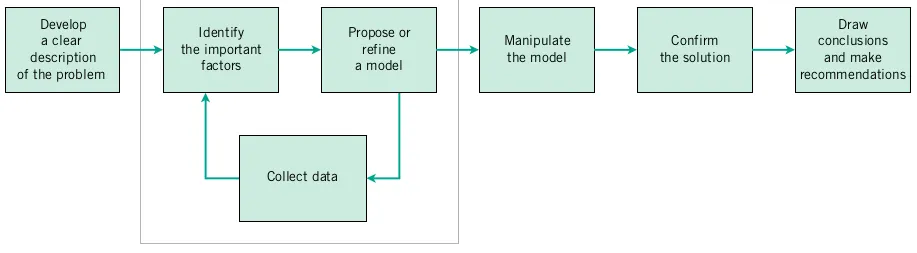
1.1 The Engineering Method and Statistical Thinking
- Engineers solve problems of interest to society by the efficient application of scientific principles.
- The engineering or scientific method is the approach to formulating and solving these problems.
1.1.1 Probability
Probability
- Used to quantify likelihood or chance
- Used to represent risk or uncertainty in engineering applications
- Can be interpreted as our degree of belief or relative frequency
1.1.2 Statistics
Statistics
- Deals with the collection, presentation, analysis, and use of data:
- Make decisions
- Solve problems
- Design products and processes
- Statistical techniques are useful for describing and understanding variability.
- By variability, we mean successive observations of a system or phenomenon do not produce exactly the same result.
- Statistics gives us a framework for describing this variability and for learning about potential sources of variability.
1.1.3 Statistical Reasoning
Statistical Reasoning
- Statistics is the science of uncertainty & variability
- Turning Data into Information
- Data → Information → Knowledge → Wisdom
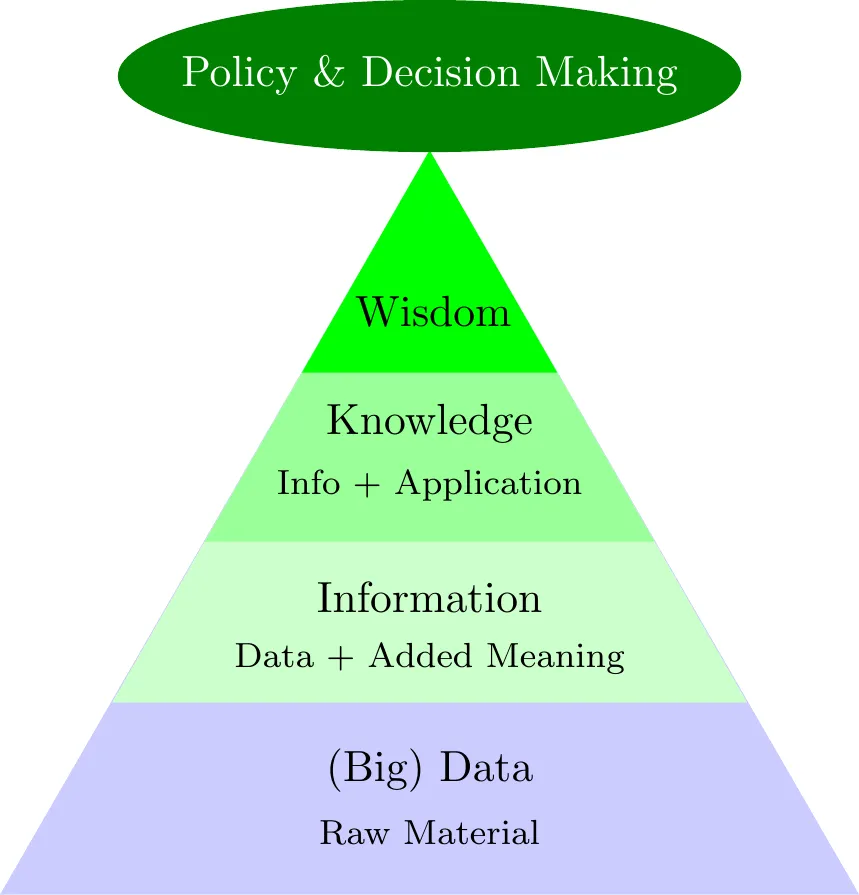
- Statistics is the Art and Science of learning from Data.
1.1.4 Definitions
Definitions
- Population
- Set of measurements of interest. Characteristics of the population (parameters) are typically of interest.
- Sample
- Subset of measurements of interest. A characteristic of the sample (statistic) is used to infer population characteristics (parameters).
- Parameter
- A characteristic of the population.
- Statistic
- A characteristic of the sample.
- Descriptive Statistics
- Describing the important characteristics of a set of data.
- Inferential Statistics
- Using sample data to make inferences (or generalizations) about a population.
- Statistical Inference
- Making a statement about the population (parameter) based on the sample (statistic).
1.1.5 Example
Example
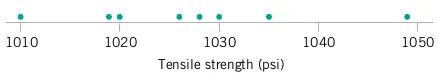
Suppose that an engineer is developing a rubber compound for use in O-rings. The O-rings are to be employed as seals in plasma etching tools used in the semiconductor industry, so their resistance to acids and other corrosive substances is an important characteristic. The engineer uses the standard rubber compound to produce eight O-rings in a development laboratory and measures the tensile strength of each specimen after immersion in a nitric acid solution at 30°C for 25 minutes [refer to the American Society for Testing and Materials (ASTM) Standard D 1414 and the associated standards for many interesting aspects of testing rubber O-rings]. The tensile strengths (in psi) of the eight O-rings are 1030, 1035, 1020, 1049, 1028, 1026, 1019, and 1010. As we should have anticipated, not all the O-ring specimens exhibit the same measurement of tensile strength.
1.1.6 Random Variable
Random Variable
- Since tensile strength varies or exhibits variability, it is a random variable.
- A random variable, X, can be model by X = \mu + \epsilon where \mu is a constant and \epsilon is a random disturbance, or “noise” term.
1.1.7 Dot Diagram
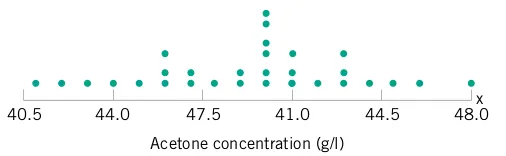
Dot Diagram
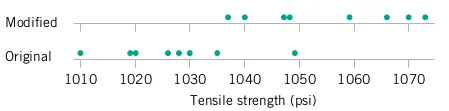
- The dot diagram is a very useful plot for displaying a small body of data - say up to about 20 observations.
- This plot allows us to see easily two features of the data; the location, or the middle, and the scatter or variability.
- The dot diagram is also very useful for comparing sets of data.
1.2 Collecting Engineering Data
Collecting Engineering Data
Three basic methods for collecting data:
- A retrospective study using historical data
- An observational study
- A designed experiment
1.2.1 Retrospective Study
Retrospective Study
A retrospective study uses either all or a sample of the historical process data from some period of time. The objective of this study might be to determine the relationships among the two temperatures and the reflux rate on the acetone concentration in the output product stream. In most such studies, the engineer is interested in using the data to construct a model relating the variables of interest.
1.2.2 Observational Study
Observational Study
An observational study simply observes the process of population during a period of routine operation.
1.2.3 Designed Experiments
Designed Experiments
The third way that engineering data are collected is with a designed experiment. In a designed experiment, the engineer makes deliberate or purposeful changes in controllable variables (called factors) of the system, observes the resulting system output, and then makes a decision or an inference about which variables are responsible for the changes that he or she observes in the output performance.
1.2.4 Random Samples
Random Samples
- Almost all statistical analysis is based on the idea of using a sample of data that has been selected from some population.
- The objective is to use the sample data to make decisions or learn something about the population.
- Only random samples are likely to be useful in statistics, as they give us the best chance of obtaining a sample that is representative of the population.
Simple Random Sample
- A simple random sample of size n is a sample that has been selected from a population in such a way that each possible sample of size n has an equally likely chance of being selected.
1.3 Observing Processes over Time
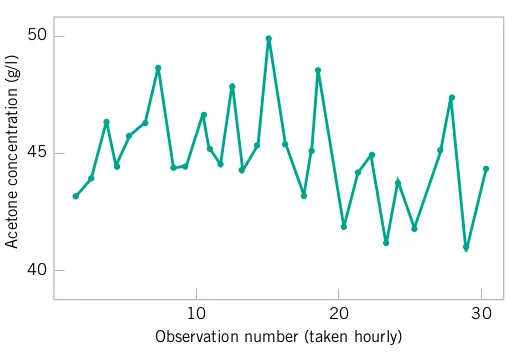
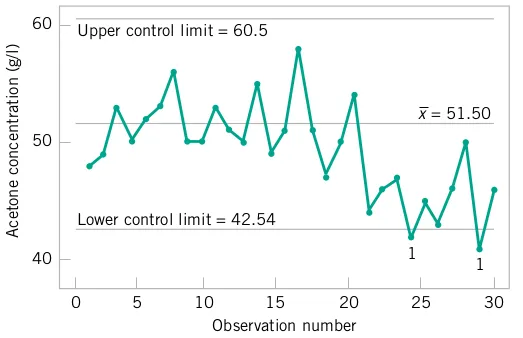
Observing Processes over Time
- Whenever data are collected over time it is important to plot the data over time. Phenomena that might affect the system or process often become more visible in a time-oriented plot and the concept of stability can be better judged.
1.4 R Software
Definition
R is a free, open-source programming language and software environment for statistical computing, bioinformatics, visualization and general computing. R provides a wide variety of statistical and graphical techniques, and is highly extensible. The latest version of R can be obtained from https://cran.r-project.org/bin/.
1.4.1 RStudio
RStudio is a powerful integrated development environment (IDE) for R, and it can be downloaded from https://www.rstudio.com/products/rstudio/download/.
1.4.2 Example Code (Minimal)
---
title: "Statistics and the Scientific Method"
format:
  html
toc: true
number-sections: true
---

# Introduction

```{r}
#| echo: true
2 + 2
5 - 2
5 * 2
6/2
```