PakNAcc
R Package
Shiny App
PakNAcc: ‘shiny’ App for National Accounts
Nov 11, 2024
This page provides links to R & LaTeX packages I have (co)authored. The most recent versions of most packages are on github. Most R packages are also available on CRAN.
agriTutorial: Tutorial Analysis of Some Agricultural Experiments
🔗 Website
💡 Example software for the analysis of data from designed experiments, especially agricultural crop experiments. The basics of the analysis of designed experiments are discussed using real examples from agricultural field trials. A range of statistical methods using a range of R statistical packages are exemplified . The experimental data is made available as separate data sets for each example and the R analysis code is made available as example code. The example code can be readily extended, as required.
bayesammi: Bayesian Estimation of the Additive Main Effects and Multiplicative Interaction Model
🔗 Website
🧠 Performs Bayesian estimation of the additive main effects and multiplicative interaction (AMMI) model. The method is explained in Crossa, J., Perez-Elizalde, S., Jarquin, D., Cotes, J.M., Viele, K., Liu, G. and Cornelius, P.L. (2011) (doi:10.2135/cropsci2010.06.0343).
baystability: Bayesian Stability Analysis of Genotype by Environment Interaction (GEI)
🔗 Website
🧪 Performs general Bayesian estimation method of linear–bilinear models for genotype × environment interaction. The method is explained in Perez-Elizalde, S., Jarquin, D., and Crossa, J. (2011) (doi:10.1007/s13253-011-0063-9).
DiallelAnalysisR: Diallel Analysis with R
🔗 Website
🔬 Performs Diallel Analysis with R using Griffing’s and Hayman’s approaches. Four different Methods (1: Method-I (Parents + F1’s + reciprocals); 2: Method-II (Parents and one set of F1’s); 3: Method-III (One set of F1’s and reciprocals); 4: Method-IV (One set of F1’s only)) and two Models (1: Fixed Effects Model; 2: Random Effects Model) can be applied using Griffing’s approach.
dmai: Divisia Monetary Aggregates Index
🔗 Website
📊 Functions to calculate Divisia monetary aggregates index as given in Barnett, W. A. (1980) (doi:10.1016/0304-4076(80)90070-6).
eda4treeR: Experimental Design and Analysis for Tree Improvement
🔗 Website
📘 Provides data sets and R Codes for Williams, E.R., Matheson, A.C. and Harwood, C.E. (2002). Experimental Design and Analysis for Tree Improvement, CSIRO Publishing.
gvcR: Genotypic Variance Components
🔗 Website
🔍 Functionalities to compute model based genetic components i.e. genotypic variance, phenotypic variance and heritability for given traits of different genotypes from replicated data using methodology explained by Burton, G. W. & Devane, E. H. (1953) (doi:10.2134/agronj1953.00021962004500100005x) and Allard, R.W. (2010, ISBN:8126524154).
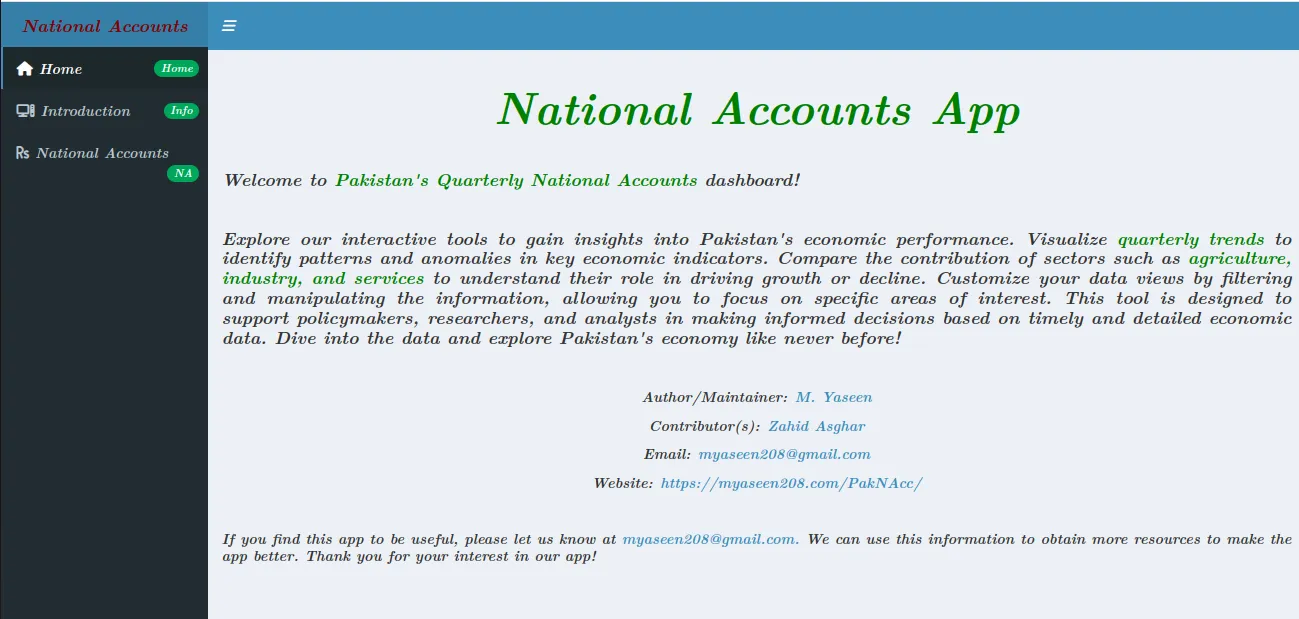
PakNAcc: ‘shiny’ App for National Accounts
🔗 Website | 🚀 Shiny App
📈 Provides a comprehensive suite of tools for analyzing Pakistan’s Quarterly National Accounts data. Users can gain detailed insights into Pakistan’s economic performance, visualize quarterly trends, and detect patterns and anomalies in key economic indicators. Compare sector contributions—including agriculture, industry, and services—to understand their influence on economic growth or decline. Customize analyses by filtering and manipulating data to focus on specific areas of interest. Ideal for policymakers, researchers, and analysts aiming to make informed, data-driven decisions based on timely and detailed economic insights.
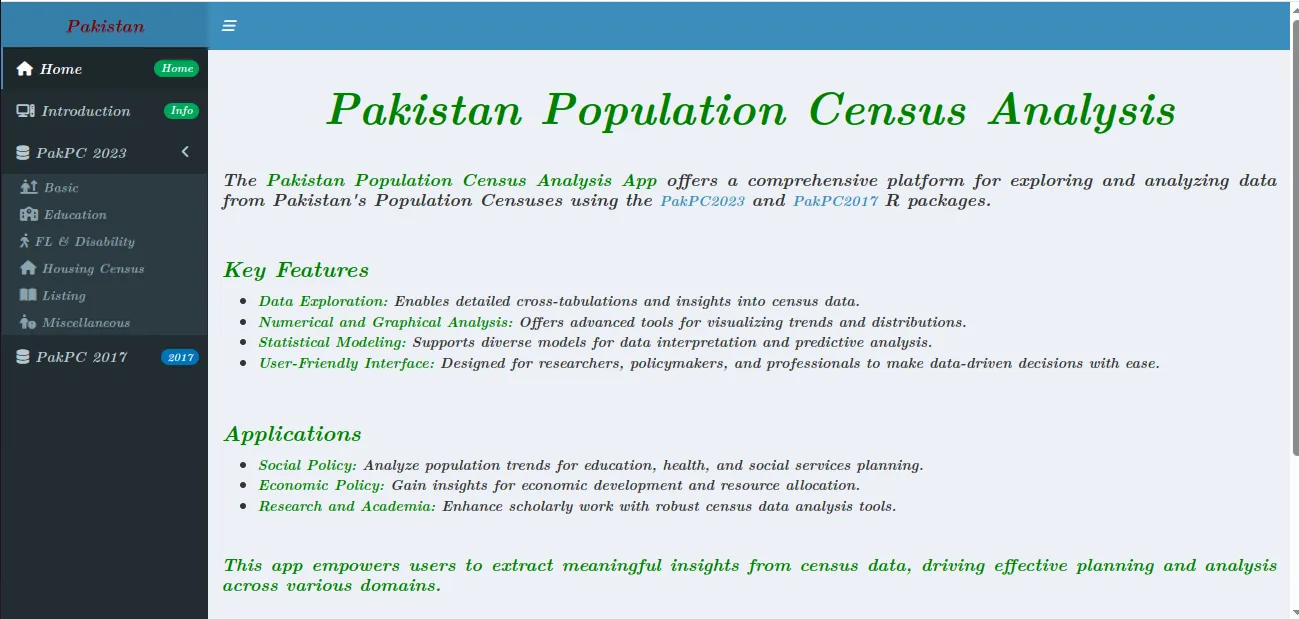
PakPC: ’shiny’ App to Analyze Pakistan’s Population Census Data
🔗 Website | 🚀 Shiny App
📉 Provides tools for analyzing Pakistan’s Population Censuses data via the ‘PakPC2023’ and ‘PakPC2017’ R packages. Designed for researchers, policymakers, and professionals, the app enables in-depth numerical and graphical analysis, including detailed cross-tabulations and insights. With diverse statistical models and visualization options, it supports informed decision-making in social and economic policy. This tool enhances users’ ability to explore and interpret census data, providing valuable insights for effective planning and analysis across various fields.
PakPC2017: Pakistan Population Census 2017
🔗 Website
🗃️ Provides data sets and functions for exploration of Pakistan Population Census 2017 (http://www.pbscensus.gov.pk/).
PakPC2023: Pakistan Population Census 2023
🔗 Website
🗃️ Provides data sets and functions for exploration of Pakistan Population Census 2023 (http://www.pbscensus.gov.pk/).
PakPMICS2014Ch: Multiple Indicator Cluster Survey (MICS) 2014 Child Questionnaire Data for Punjab, Pakistan
🔗 Website
🧒 Provides data set and functions for exploration of Multiple Indicator Cluster Survey (MICS) 2014 Child questionnaire data for Punjab, Pakistan (http://www.mics.unicef.org/surveys).
PakPMICS2014HH: Multiple Indicator Cluster Survey (MICS) 2014 Household Questionnaire Data for Punjab, Pakistan
🔗 Website
🏡 Provides data set and function for exploration of Multiple Indicator Cluster Survey (MICS) 2014 Household questionnaire data for Punjab, Pakistan (http://www.mics.unicef.org/surveys).
PakPMICS2014HL: Multiple Indicator Cluster Survey (MICS) 2014 Household Listing Questionnaire Data for Punjab, Pakistan
🔗 Website
📄 Provides data set and function for exploration of Multiple Indicator Cluster Survey 2014 Household Listing questionnaire data for Punjab, Pakistan.
PakPMICS2014Wm: Multiple Indicator Cluster Survey (MICS) 2014 Women Questionnaire Data for Punjab, Pakistan
🔗 Website
👩👧 Provides data set and function for exploration of Multiple Indicator Cluster Survey 2014 Women (age 15-49 years) questionnaire data for Punjab, Pakistan.
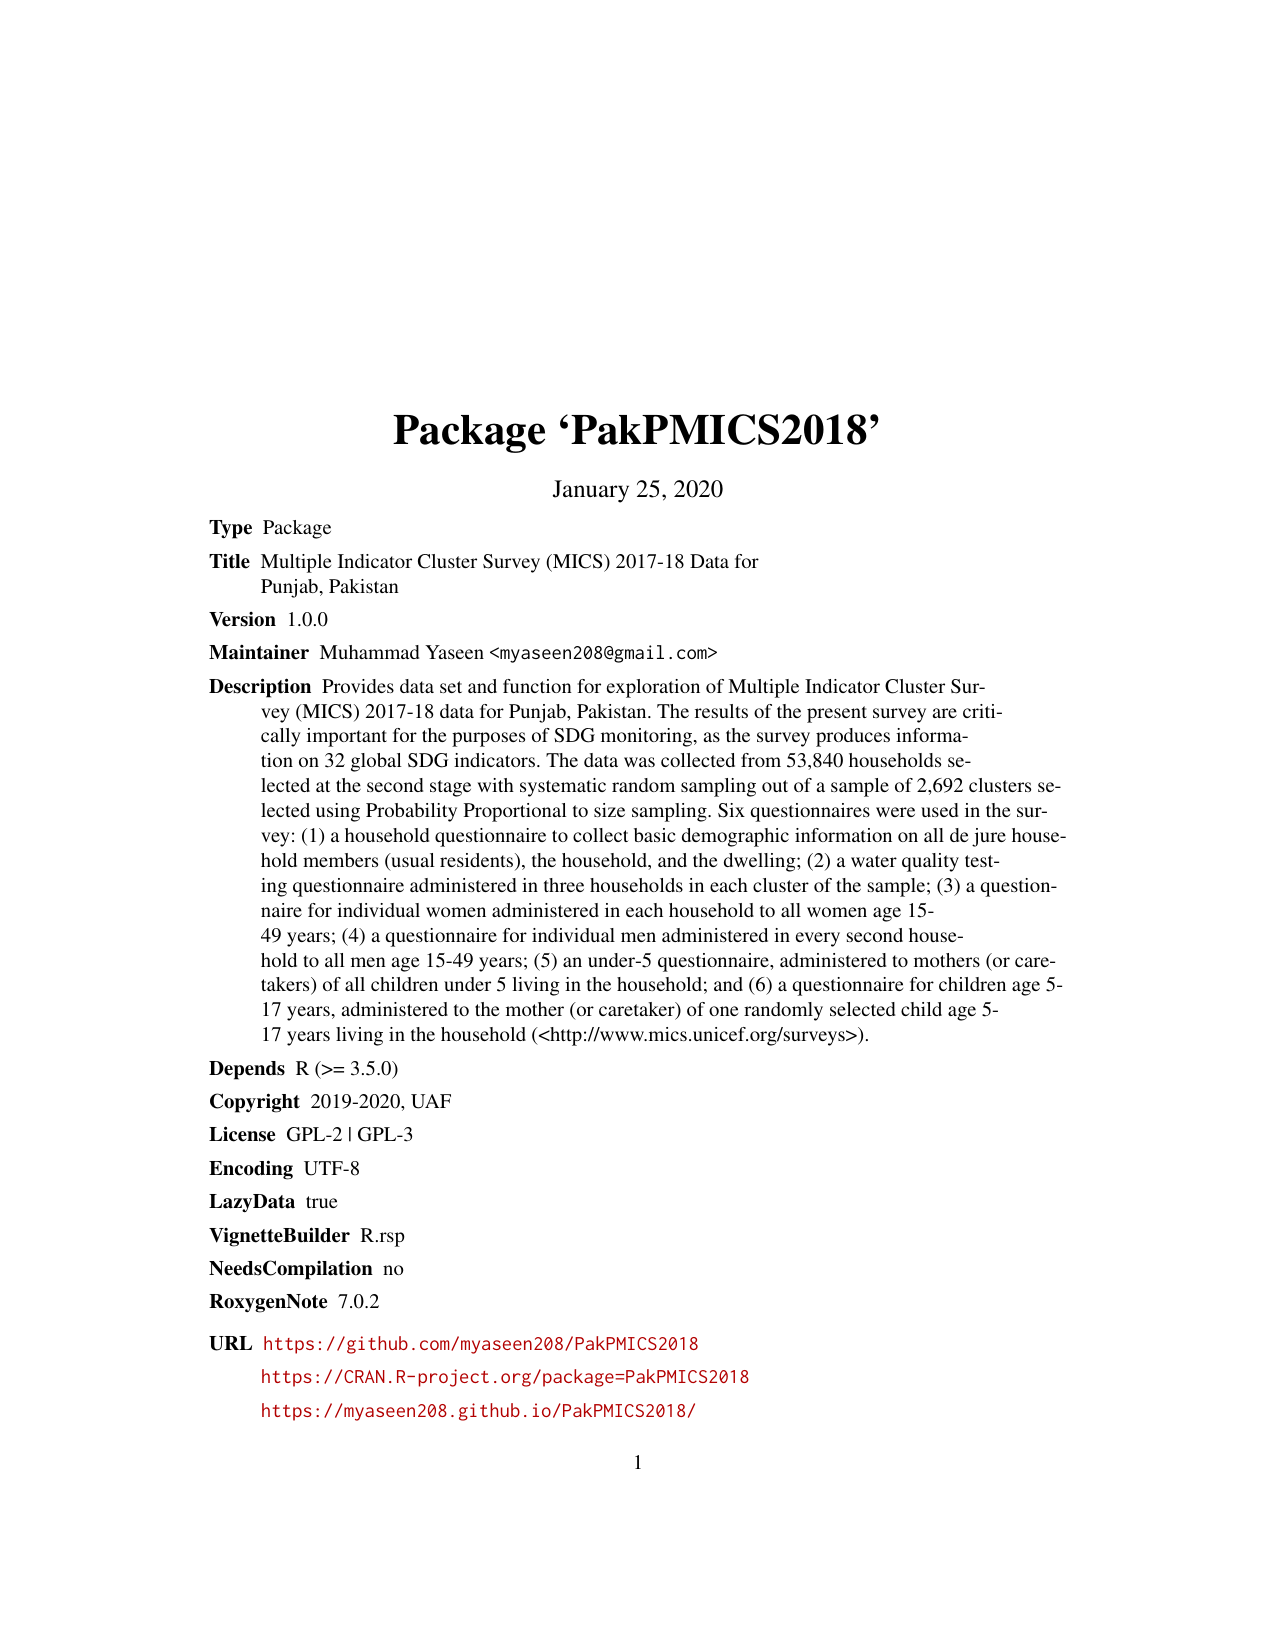
PakPMICS2018: Multiple Indicator Cluster Survey (MICS) 2017-18 Data for Punjab, Pakistan
🔗 Website
📊 Provides data set and function for exploration of Multiple Indicator Cluster Survey (MICS) 2017-18 data for Punjab, Pakistan. The results of the present survey are critically important for the purposes of SDG monitoring, as the survey produces information on 32 global SDG indicators. The data was collected from 53,840 households selected at the second stage with systematic random sampling out of a sample of 2,692 clusters selected using Probability Proportional to size sampling. Six questionnaires were used in the survey: (1) a household questionnaire to collect basic demographic information on all de jure household members (usual residents), the household, and the dwelling; (2) a water quality testing questionnaire administered in three households in each cluster of the sample; (3) a questionnaire for individual women administered in each household to all women age 15-49 years; (4) a questionnaire for individual men administered in every second household to all men age 15-49 years; (5) an under-5 questionnaire, administered to mothers (or caretakers) of all children under 5 living in the household; and (6) a questionnaire for children age 5-17 years, administered to the mother (or caretaker) of one randomly selected child age 5-17 years living in the household (http://www.mics.unicef.org/surveys).
PakPMICS2018bh: Multiple Indicator Cluster Survey (MICS) 2017-18 Birth History of Children Questionnaire Data for Punjab, Pakistan
🔗 Website
📋 Provides data set and function for exploration of Multiple Indicator Cluster Survey (MICS) 2017-18 Household questionnaire data for Punjab, Pakistan. The results of the present survey are critically important for the purposes of SDG monitoring, as the survey produces information on 32 global SDG indicators. The data was collected from 53,840 households selected at the second stage with systematic random sampling out of a sample of 2,692 clusters selected using Probability Proportional to size sampling. Six questionnaires were used in the survey: (1) a household questionnaire to collect basic demographic information on all de jure household members (usual residents), the household, and the dwelling; (2) a water quality testing questionnaire administered in three households in each cluster of the sample; (3) a questionnaire for individual women administered in each household to all women age 15-49 years; (4) a questionnaire for individual men administered in every second household to all men age 15-49 years; (5) an under-5 questionnaire, administered to mothers (or caretakers) of all children under 5 living in the household; and (6) a questionnaire for children age 5-17 years, administered to the mother (or caretaker) of one randomly selected child age 5-17 years living in the household (http://www.mics.unicef.org/surveys).
PakPMICS2018fs: Multiple Indicator Cluster Survey (MICS) 2017-18 Children Age 5-17 Questionnaire Data for Punjab, Pakistan
🔗 Website
📚 Provides data set and function for exploration of Multiple Indicator Cluster Survey (MICS) 2017-18 Children Age 5-17 questionnaire data for Punjab, Pakistan. The results of the present survey are critically important for the purposes of Sustainable Development Goals (SDGs) monitoring, as the survey produces information on 32 global Sustainable Development Goals (SDGs) indicators. The data was collected from 53,840 households selected at the second stage with systematic random sampling out of a sample of 2,692 clusters selected using probability proportional to size sampling. Six questionnaires were used in the survey: (1) a household questionnaire to collect basic demographic information on all de jure household members (usual residents), the household, and the dwelling; (2) a water quality testing questionnaire administered in three households in each cluster of the sample; (3) a questionnaire for individual women administered in each household to all women age 15-49 years; (4) a questionnaire for individual men administered in every second household to all men age 15-49 years; (5) an under-5 questionnaire, administered to mothers (or caretakers) of all children under 5 living in the household; and (6) a questionnaire for children age 5-17 years, administered to the mother (or caretaker) of one randomly selected child age 5-17 years living in the household (http://www.mics.unicef.org/surveys).
PakPMICS2018hh: Multiple Indicator Cluster Survey (MICS) 2017-18 Household Questionnaire Data for Punjab, Pakistan
🔗 Website
📈 Provides data set and function for exploration of Multiple Indicator Cluster Survey (MICS) 2017-18 Household questionnaire data for Punjab, Pakistan. The results of the present survey are critically important for the purposes of Sustainable Development Goals (SDGs) monitoring, as the survey produces information on 32 global Sustainable Development Goals (SDGs) indicators. The data was collected from 53,840 households selected at the second stage with systematic random sampling out of a sample of 2,692 clusters selected using probability proportional to size sampling. Six questionnaires were used in the survey: (1) a household questionnaire to collect basic demographic information on all de jure household members (usual residents), the household, and the dwelling; (2) a water quality testing questionnaire administered in three households in each cluster of the sample; (3) a questionnaire for individual women administered in each household to all women age 15-49 years; (4) a questionnaire for individual men administered in every second household to all men age 15-49 years; (5) an under-5 questionnaire, administered to mothers (or caretakers) of all children under 5 living in the household; and (6) a questionnaire for children age 5-17 years, administered to the mother (or caretaker) of one randomly selected child age 5-17 years living in the household (http://www.mics.unicef.org/surveys).
PakPMICS2018mm: Multiple Indicator Cluster Survey (MICS) 2017-18 Maternal Mortality Questionnaire Data for Punjab, Pakistan
🔗 Website
⚕️ Provides data set and function for exploration of Multiple Indicator Cluster Survey (MICS) 2017-18 Maternal Mortality questionnaire data for Punjab, Pakistan. The results of the present survey are critically important for the purposes of Sustainable Development Goals (SDGs) monitoring, as the survey produces information on 32 global Sustainable Development Goals (SDGs) indicators. The data was collected from 53,840 households selected at the second stage with systematic random sampling out of a sample of 2,692 clusters selected using probability proportional to size sampling. Six questionnaires were used in the survey: (1) a household questionnaire to collect basic demographic information on all de jure household members (usual residents), the household, and the dwelling; (2) a water quality testing questionnaire administered in three households in each cluster of the sample; (3) a questionnaire for individual women administered in each household to all women age 15-49 years; (4) a questionnaire for individual men administered in every second household to all men age 15-49 years; (5) an under-5 questionnaire, administered to mothers (or caretakers) of all children under 5 living in the household; and (6) a questionnaire for children age 5-17 years, administered to the mother (or caretaker) of one randomly selected child age 5-17 years living in the household (http://www.mics.unicef.org/surveys).
PakPMICS2018mn: Multiple Indicator Cluster Survey (MICS) 2017-18 Men Questionnaire Data for Punjab, Pakistan
🔗 Website
🧔 Provides data set and function for exploration of Multiple Indicator Cluster Survey (MICS) 2017-18 Men questionnaire data for Punjab, Pakistan. The results of the present survey are critically important for the purposes of Sustainable Development Goals (SDGs) monitoring, as the survey produces information on 32 global Sustainable Development Goals (SDGs) indicators. The data was collected from 53,840 households selected at the second stage with systematic random sampling out of a sample of 2,692 clusters selected using probability proportional to size sampling. Six questionnaires were used in the survey: (1) a household questionnaire to collect basic demographic information on all de jure household members (usual residents), the household, and the dwelling; (2) a water quality testing questionnaire administered in three households in each cluster of the sample; (3) a questionnaire for individual women administered in each household to all women age 15-49 years; (4) a questionnaire for individual men administered in every second household to all men age 15-49 years; (5) an under-5 questionnaire, administered to mothers (or caretakers) of all children under 5 living in the household; and (6) a questionnaire for children age 5-17 years, administered to the mother (or caretaker) of one randomly selected child age 5-17 years living in the household (http://www.mics.unicef.org/surveys).
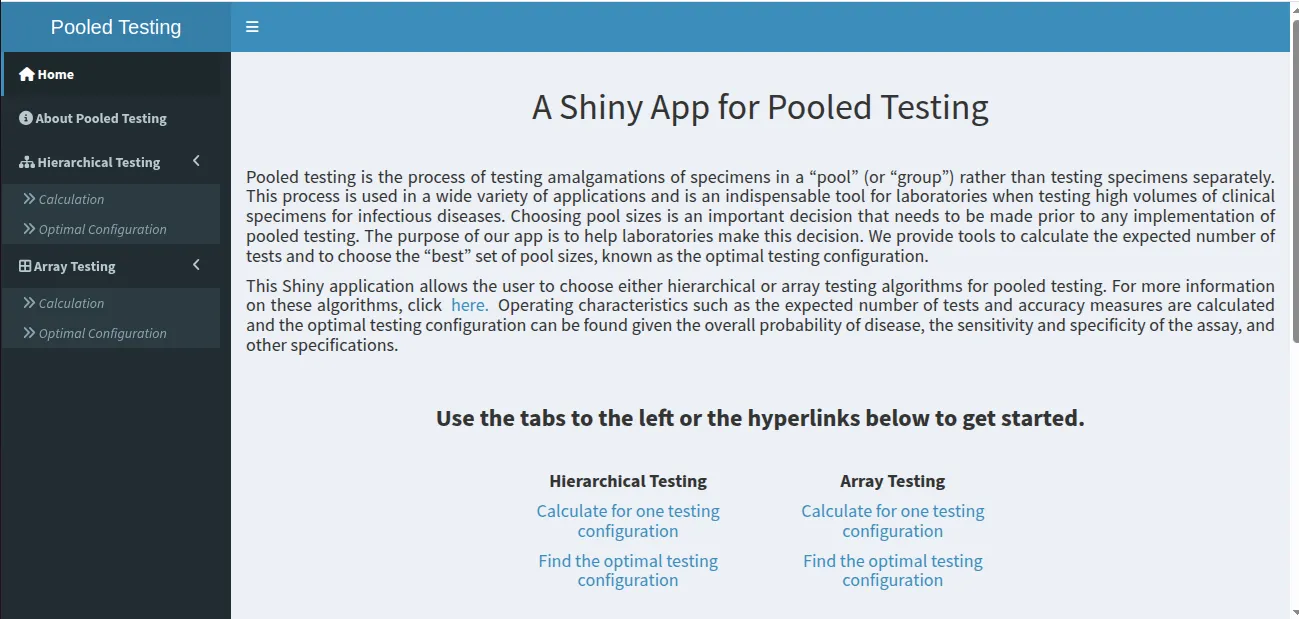
PooledTesting: A Shiny App for Pooled Testing
🔗 Website | 🚀 Shiny App
Pooled testing is the process of testing amalgamations of specimens in a “pool” (or “group”) rather than testing specimens separately. This process is used in a wide variety of applications and is an indispensable tool for laboratories when testing high volumes of clinical specimens for infectious diseases. Choosing pool sizes is an important decision that needs to be made prior to any implementation of pooled testing. The purpose of our app is to help laboratories make this decision. We provide tools to calculate the expected number of tests and to choose the “best” set of pool sizes, known as the optimal testing configuration. This Shiny application allows the user to choose either hierarchical or array testing algorithms for pooled testing. For more information on these algorithms. Operating characteristics such as the expected number of tests and accuracy measures are calculated and the optimal testing configuration can be found given the overall probability of disease, the sensitivity and specificity of the assay, and other specifications.
ppcSpatial: Spatial Analysis of Pakistan Population Census
🔗 Website
Spatial Analysis for exploration of Pakistan Population Census 2017 (http://www.pbscensus.gov.pk/). It uses data from R package ‘PakPC2017’.
PSLM2015: Pakistan Social and Living Standards Measurement Survey 2014-15
🔗 Website
Data and statistics of Pakistan Social and Living Standards Measurement (PSLM) survey 2014-15 from Pakistan Bureau of Statistics (http://www.pbs.gov.pk/).
qccrs: Quality Control Charts under Repetitive Sampling
🔗 Website
Functions to calculate Average Sample Numbers (ASN), Average Run Length (ARL1) and value of k, k1 and k2 for quality control charts under repetitive sampling as given in Aslam et al. (2014) (doi:10.7232/iems.2014.13.1.101).
rgsp: Repetitive Group Sampling Plan Based on Cpk
🔗 Website
Functions to calculate Sample Number and Average Sample Number for Repetitive Group Sampling Plan Based on Cpk as given in Aslam et al. (2013) (doi:10.1080/00949655.2012.663374).
stability: Stability Analysis of Genotype by Environment Interaction (GEI)
🔗 Website
Functionalities to perform Stability Analysis of Genotype by Environment Interaction (GEI) to identify superior and stable genotypes under diverse environments. It performs Eberhart & Russel’s ANOVA (1966) (doi:10.2135/cropsci1966.0011183X000600010011x), Finlay and Wilkinson (1963) Joint Linear Regression (doi:10.1071/AR9630742), Wricke (1962, 1964) Ecovalence, Shukla’s stability variance parameter (1972) (doi:10.1038/hdy.1972.87) and Kang’s (1991) (doi:10.2134/agronj1991.00021962008300010037x) simultaneous selection for high yielding and stable parameter.
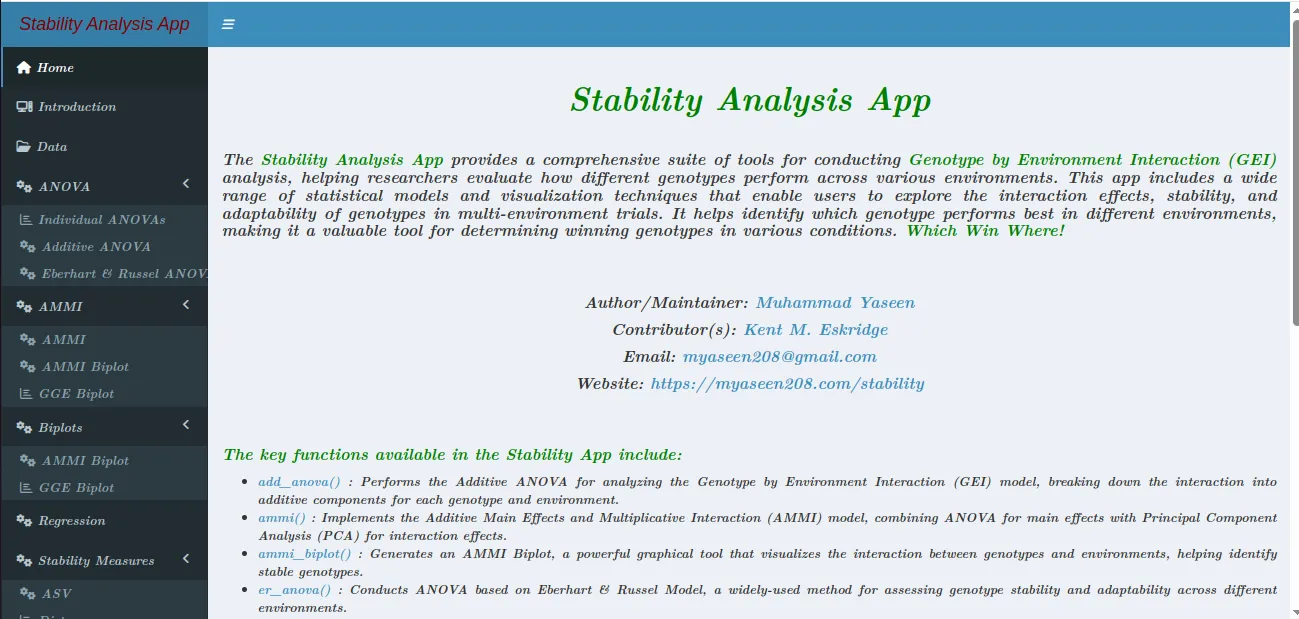
StabilityApp: Stability Analysis App for GEI in Multi-Environment Trials
🔗 Website | 🚀 Shiny App
Provides tools for Genotype by Environment Interaction (GEI) analysis, using statistical models and visualizations to assess genotype performance across environments. It helps researchers explore interaction effects, stability, and adaptability in multi-environment trials, identifying the best-performing genotypes in different conditions. Which Win Where!
StroupGLMM: R Codes and Datasets for Generalized Linear Mixed Models: Modern Concepts, Methods and Applications by Walter W. Stroup
🔗 Website
R Codes and Datasets for Stroup, W. W. (2012). Generalized Linear Mixed Models: Modern Concepts, Methods and Applications, CRC Press.
SupMZ: Detecting Structural Change with Heteroskedasticity
🔗 Website
Calculates the sup MZ value to detect the unknown structural break points under Heteroskedasticity as given in Ahmed et al. (2017) (doi:10.1080/03610926.2016.1235200).
VetResearchLMM: Linear Mixed Models: An Introduction with Applications in Veterinary Research
🔗 Website
R Codes and Datasets for Duchateau, L. and Janssen, P. and Rowlands, G. J. (1998). Linear Mixed Models. An Introduction with applications in Veterinary Research. International Livestock Research Institute.
UAFSynopsis: LaTeX Class for University Synopsis
🔗 Website
LaTeX class for the Synopsis of the University of Agriculture, Faisalabad-Pakistan
UAFThesis: LaTeX Class for University Thesis
🔗 Website
LaTeX class for the Thesis of the University of Agriculture, Faisalabad-Pakistan
PakJAS: LaTeX Class for Pakistan Journal of Agricultural Sciences
🔗 Website
LaTeX class for Pakistan Journal of Agricultural Sciences