knitr::read_chunk("2022-05-20_TUF.R")Statistics: The Art & Science of Learning from Data
Data Science
Statistics
Biostatistics
Bioinformatics
Research
R
An exploration of statistics as the art and science of learning from data, covering data science, biostatistics, and bioinformatics principles.
Introduction
Statistics
- Statistics is the science of uncertainty & variability
- Statistics turns data into information
- Data -> Information -> Knowledge -> Wisdom
- Data Driven Decisions (3Ds)
- Statistics is the interpretation of Science
- Statistics is the Art & Science of learning from data
Variable
- Characteristic that may vary from individual to individual
- Height, Weight, CGPA etc
Measurement
- Process of assigning numbers or labels to objects or states in accordance with logically accepted rules
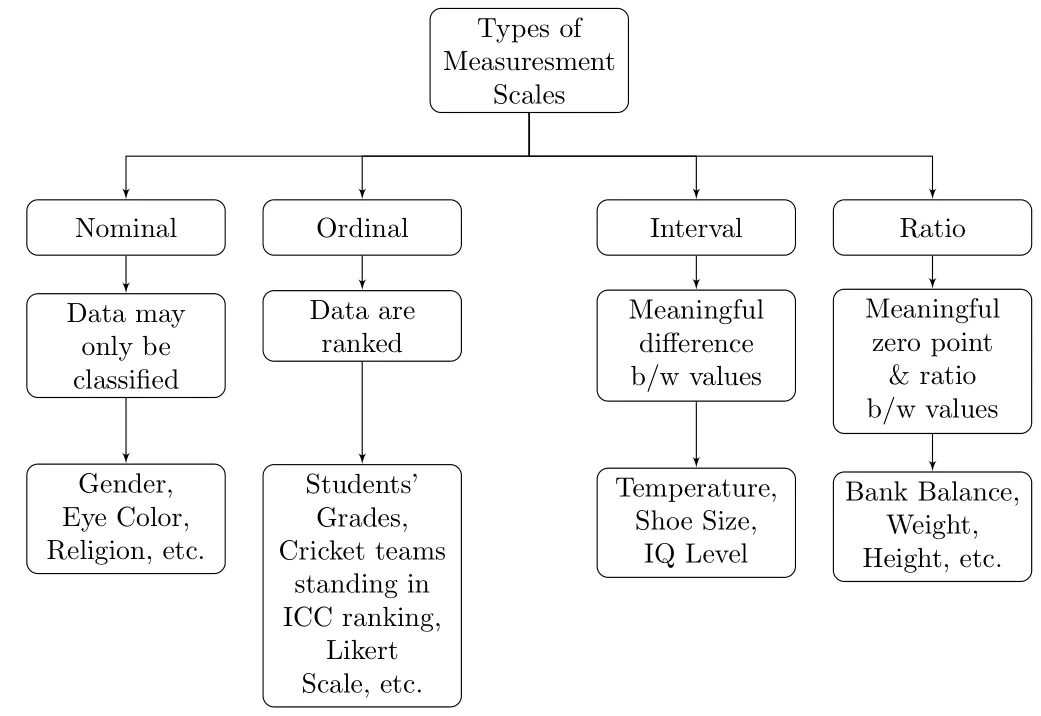
Measurement Scales
- Nominal Scale: Obersvations may be classified into mutually exclusive & exhaustive classes or categories
- Ordinal Scale: Obersvations may be ranked
- Interval Scale: Difference between obersvations is meaningful
- Ratio Scale: Ratio between obersvations is meaningful & true zero point
Exploring Data with Graphs & Numerical Summaries
Graphs
Numerical Summaries
Example
The following data shows the ID, Gender (Male, Female), Age, Race (Mexican American, Non-Hispanic Black, Non-Hispanic White, Other Hispanic, Other/Mixed), BMI, and BMI.Cat (Under Weight, Normal Weight, Over Weight, Obese) from the National Health and Nutrition Examination Survey (NHANES). The survey is conducted by the National Center for Health Statistics (NCHS), and data are publicly available at: https://www.cdc.gov/nchs/nhanes.htm . NHANES data are reported in well over one thousand peer-reviewed journal publications every year.
Descriptive Statistics
- Number of Observations
- Measures of Central Tendency
- Measures of Central Dispersion
- Measures of Skewness
- Measures of Kurtosis
Example
The following data shows the ID, Gender (Male, Female), Age, Race (Mexican American, Non-Hispanic Black, Non-Hispanic White, Other Hispanic, Other/Mixed), BMI, and BMI.Cat (Under Weight, Normal Weight, Over Weight, Obese) from the National Health and Nutrition Examination Survey (NHANES). The survey is conducted by the National Center for Health Statistics (NCHS), and data are publicly available at: https://www.cdc.gov/nchs/nhanes.htm . NHANES data are reported in well over one thousand peer-reviewed journal publications every year.
Correlation Analysis
Example
The following data shows the ID, Gender (Male, Female), Age, Race (Mexican American, Non-Hispanic Black, Non-Hispanic White, Other Hispanic, Other/Mixed), BMI, and BMI.Cat (Under Weight, Normal Weight, Over Weight, Obese) from the National Health and Nutrition Examination Survey (NHANES). The survey is conducted by the National Center for Health Statistics (NCHS), and data are publicly available at: https://www.cdc.gov/nchs/nhanes.htm . NHANES data are reported in well over one thousand peer-reviewed journal publications every year.
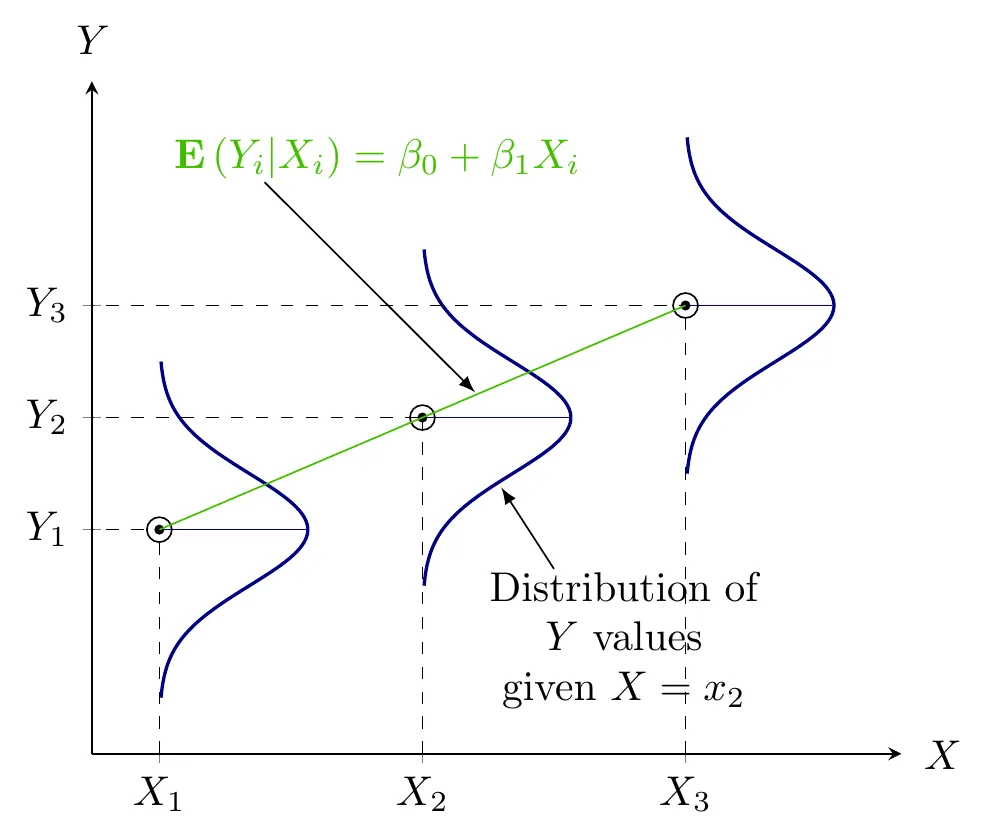
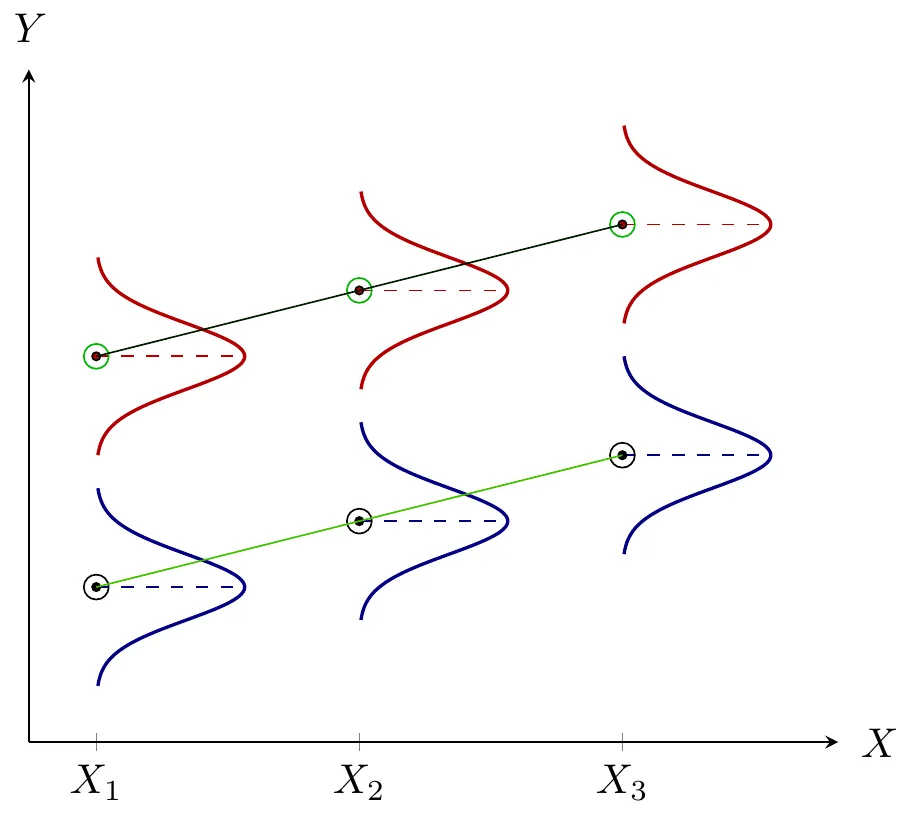
An Introduction to Linear Models
Regression Analysis
- Quantifying dependency of a normal response on quantitative explanatory variable(s)
Example
The following data shows the ID, Gender (Male, Female), Age, Race (Mexican American, Non-Hispanic Black, Non-Hispanic White, Other Hispanic, Other/Mixed), BMI, and BMI.Cat (Under Weight, Normal Weight, Over Weight, Obese) from the National Health and Nutrition Examination Survey (NHANES). The survey is conducted by the National Center for Health Statistics (NCHS), and data are publicly available at: https://www.cdc.gov/nchs/nhanes.htm . NHANES data are reported in well over one thousand peer-reviewed journal publications every year.
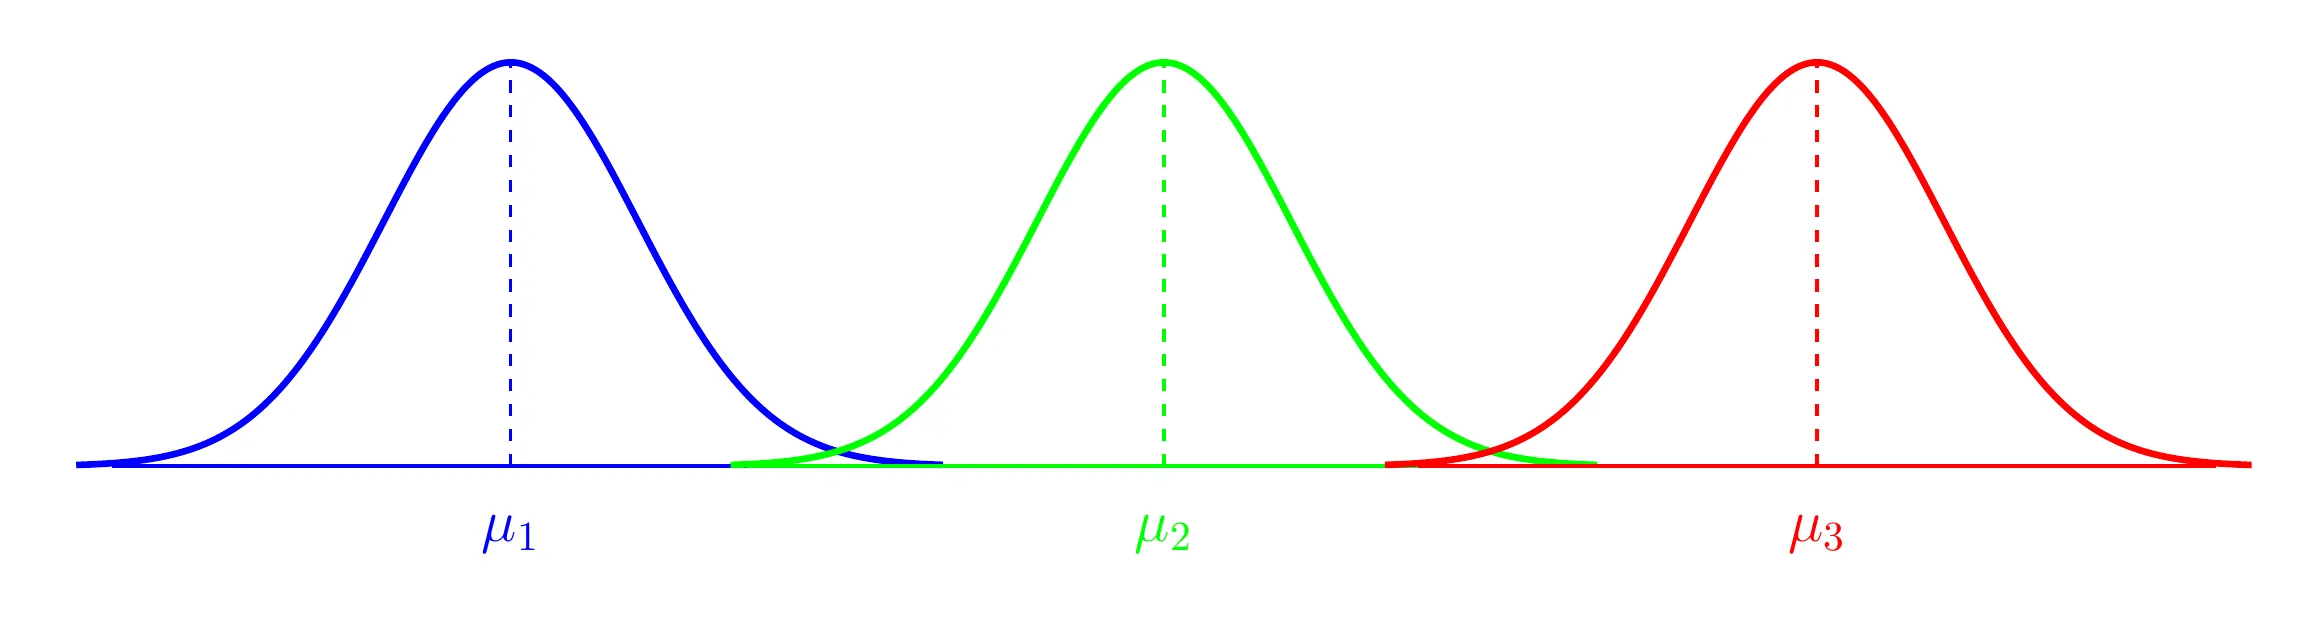
Analysis of Variance (ANOVA)
- Comparing means of Normal dependent variable for levels of different factor(s)
Example
The following data shows the ID, Gender (Male, Female), Age, Race (Mexican American, Non-Hispanic Black, Non-Hispanic White, Other Hispanic, Other/Mixed), BMI, and BMI.Cat (Under Weight, Normal Weight, Over Weight, Obese) from the National Health and Nutrition Examination Survey (NHANES). The survey is conducted by the National Center for Health Statistics (NCHS), and data are publicly available at: https://www.cdc.gov/nchs/nhanes.htm . NHANES data are reported in well over one thousand peer-reviewed journal publications every year.
Analysis of Covariance (ANCOVA)
- Quantifying dependency of a normal response on quantitative explanatory variable(s)
- Comparing means of Normal dependent variable for levels of different factor(s)
Example
The following data shows the ID, Gender (Male, Female), Age, Race (Mexican American, Non-Hispanic Black, Non-Hispanic White, Other Hispanic, Other/Mixed), BMI, and BMI.Cat (Under Weight, Normal Weight, Over Weight, Obese) from the National Health and Nutrition Examination Survey (NHANES). The survey is conducted by the National Center for Health Statistics (NCHS), and data are publicly available at: https://www.cdc.gov/nchs/nhanes.htm . NHANES data are reported in well over one thousand peer-reviewed journal publications every year.
R Software
RStudio
R Short Reference Card
2009 New York Times Article on R
2015 Nature Article on R
Citation
BibTeX citation:
@online{yaseen2022,
  author = {Yaseen, Muhammad and Yaseen, Muhammad},
  title = {Statistics: {The} {Art} \& {Science} of {Learning} from
    {Data}},
  date = {2022-05-20},
  url = {https://myaseen208.com/blogs/2022-05-20_TUF/},
  langid = {en}
}
For attribution, please cite this work as:
Yaseen, Muhammad, and Muhammad Yaseen. 2022. “Statistics: The Art
& Science of Learning from Data.” May 20. https://myaseen208.com/blogs/2022-05-20_TUF/.