Hayman is used for performing Diallel Analysis using Hayman's Approach.
Value
Means Means
ANOVA Analysis of Variance (ANOVA) table
Genetic.Components Genetic Components
Effects Effects of Crosses
StdErr Standard Errors of Crosses
References
Hayman, B. I. (1954 a) The Theory and Analysis of Diallel Crosses. Genetics, 39, 789–809.
Hayman, B. I. (1954 b) The Analysis of Variance of Diallel Tables. Biometrics, 10, 235–244.
Hayman, B. I. (1957) Interaction, Heterosis and Diallel Crosses. Genetics, 42, 336–355.
Singh, R. K. and Chaudhary, B. D. (2004) Biometrical Methods in Quantitative Genetic Analysis. New Delhi: Kalyani.
Author
Muhammad Yaseen (myaseen208@gmail.com)
Examples
#------------------------------------------
## Diallel Analysis with Haymans's Aproach
#------------------------------------------

Hayman1Data <-
 Hayman(
     y      = Yield
   , Rep    = Rep
   , Cross1 = Cross1
   , Cross2 = Cross2
   , data   = HaymanData
   )

Hayman1Data
#> $Means
#>         Cross1  Cross2  Cross3  Cross4   Cross5  Cross6   Cross7  Cross8
#> Cross1  85.645  87.010  90.455 114.945 120.2900  68.550 107.6425  52.640
#> Cross2  80.690  98.260 111.575  88.170  99.9300  73.265  97.6400  85.650
#> Cross3 102.230 104.555  74.070 100.645  94.2850 100.885 111.5400 117.735
#> Cross4 119.115  89.310 102.675  91.640  85.2850 105.795  64.4500  46.855
#> Cross5 111.290 102.890  88.265  83.390  54.1025  84.150  81.9350  94.820
#> Cross6  68.835  71.295  99.575 108.665  87.9650 100.390 121.6100  53.740
#> Cross7 109.265  87.820 108.445  57.650  78.7500 115.670  90.9600 125.270
#> Cross8  48.720  83.145 115.400  46.740  93.3200  60.240 118.1700  82.000
#>
#> $ANOVA
#>                 Df Sum Sq Mean Sq F value    Pr(>F)
#> Total          255 127716
#> Rep              3   1036   345.4  3.0006  0.031825 *
#> Treatment       63 104924  1665.5 14.4683 < 2.2e-16 ***
#>   Additive       7  15219  2174.1 18.8868 < 2.2e-16 ***
#>   Non-Additive  28  88243  3151.5 27.3783 < 2.2e-16 ***
#>       b1         1   1368  1367.6 11.8807  0.000699 ***
#>       b2         7  13530  1932.9 16.7915 < 2.2e-16 ***
#>       b3        20  73345  3667.3 31.8586 < 2.2e-16 ***
#>   Maternal       7    311    44.4  0.3856  0.910004
#>   Reciprocal    21   1151    54.8  0.4763  0.975768
#> Error          189  21756   115.1
#> ---
#> Signif. codes:  0 ‘***’ 0.001 ‘**’ 0.01 ‘*’ 0.05 ‘.’ 0.1 ‘ ’ 1
#>
#> $VOLO
#> [1] 224.9646
#>
#> $In.Value
#> [1] 315.1641
#>
#> $a
#> [1] 92.20385
#>
#> $b
#> [1] -0.2184088
#>
#> $Wr.Vr.Table
#>                Wr       Vr Wr.Minus.Vr Wr.Plus.Vr       Yr      Wri
#> Cross1 -132.56217 532.6487   -665.2108  400.08649  85.6450 346.1605
#> Cross2  -92.09404 134.8819   -226.9759   42.78784  98.2600 174.1943
#> Cross3   79.64105 196.9768   -117.3358  276.61788  74.0700 210.5061
#> Cross4   34.63611 495.1323   -460.4962  529.76840  91.6400 333.7473
#> Cross5  158.46976 352.0611   -193.5914  510.53087  54.1025 281.4273
#> Cross6   39.23575 506.7741   -467.5384  546.00985 100.3900 337.6481
#> Cross7   32.77330 424.9207   -392.1474  457.69404  90.9600 309.1798
#> Cross8 -153.93912 888.8355  -1042.7746  734.89634  82.0000 447.1650
#>                Wrei      Wreip
#> Cross1  -24.1312782   86.88985
#> Cross2   62.7444691 -310.87692
#> Cross3   49.1823885 -248.78198
#> Cross4  -15.9373750   49.37348
#> Cross5   15.3106225  -93.69769
#> Cross6  -18.4800492   61.01530
#> Cross7   -0.6025568  -20.83807
#> Cross8 -101.9255955  443.07665
#>
#> $Components.of.Variation
#>      Estimate    StdErr   t.value
#> E    29.67728  74.84918 0.3964944
#> D   195.28734 224.54754 0.8696926
#> F   422.33301 530.58515 0.7959759
#> H1 1926.38733 516.20165 3.7318504
#> H2 1859.08553 449.09509 4.1396256
#> h2  136.59673 317.04090 0.4308489
#>
#> $Other.Parameters
#>   Other.Parameters
#> 1       3.14076006
#> 2       0.24126580
#> 3       2.05009853
#> 4      -0.19614373
#> 5       0.03847236
#> 6       0.07347523
#> 7      -0.19265899
#>
#> $Fr
#>            Fr
#> Fr1  496.7580
#> Fr2 1211.3553
#> Fr3  743.6952
#> Fr4  237.3941
#> Fr5  275.8692
#> Fr6  204.9112
#> Fr7  381.5429
#> Fr8 -172.8617
#>
names(Hayman1Data)
#>  [1] "Means"                   "ANOVA"
#>  [3] "VOLO"                    "In.Value"
#>  [5] "a"                       "b"
#>  [7] "Wr.Vr.Table"             "Components.of.Variation"
#>  [9] "Other.Parameters"        "Fr"

Hayman1DataMeans <- Hayman1Data$Means
Hayman1DataANOVA <- Hayman1Data$ANOVA
Hayman1DataWr.Vr.Table <- Hayman1Data$Wr.Vr.Table

Hayman1DataComponents.of.Variation <- Hayman1Data$Components.of.Variation
Hayman1DataOther.Parameters <- Hayman1Data$Other.Parameters
Hayman1DataFr <- Hayman1Data$Fr

#----------------
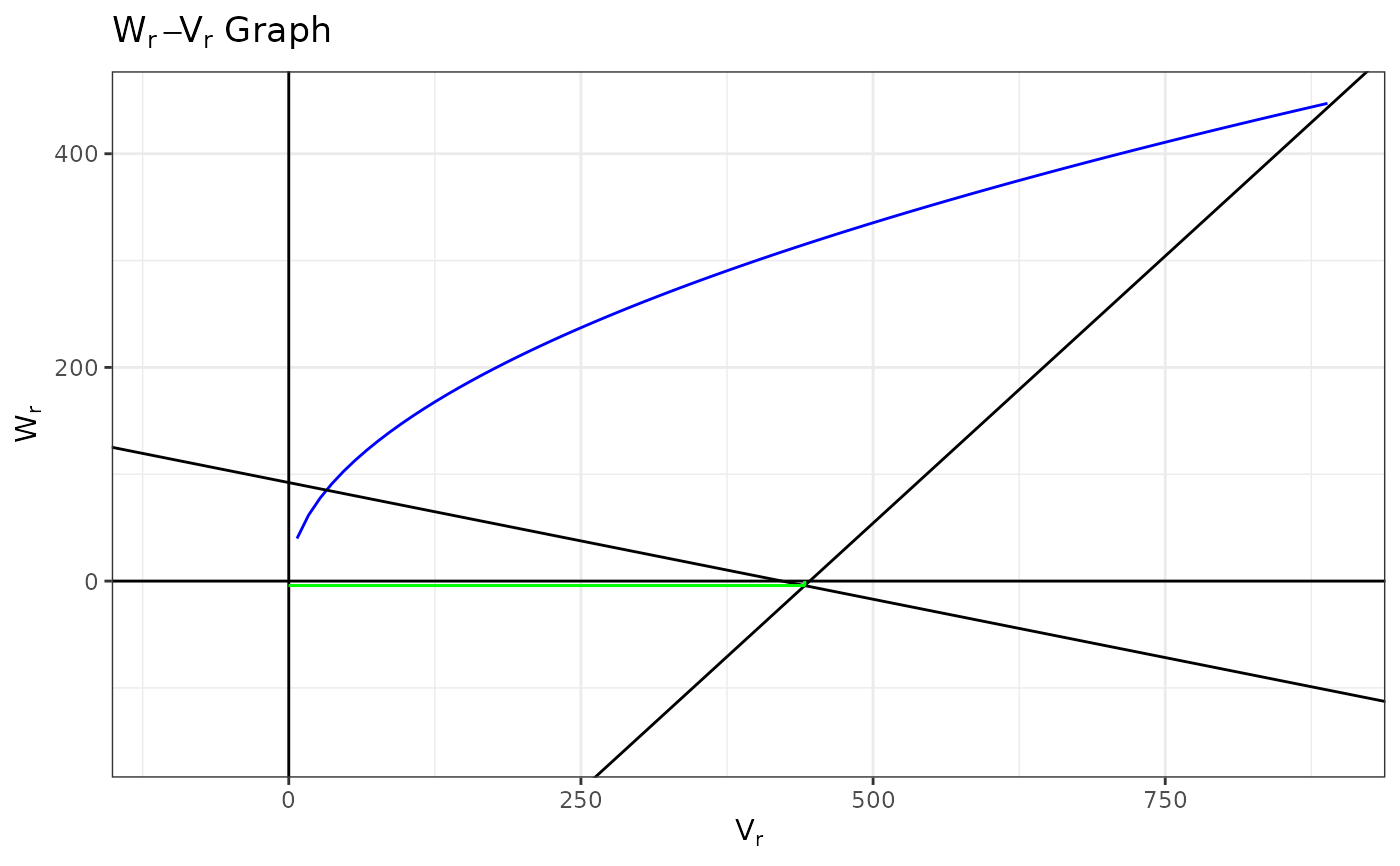
# Wr-Vr Graph
#----------------
VOLO     <- Hayman1Data$VOLO
In.Value <- Hayman1Data$In.Value
a        <- Hayman1Data$a
b        <- Hayman1Data$b
Wr.Vr    <- Hayman1Data$Wr.Vr.Table


library(ggplot2)
ggplot(data=data.frame(x=c(0, max(In.Value, Wr.Vr$Vr, Wr.Vr$Wr, Wr.Vr$Wrei))), aes(x)) +
  stat_function(fun=function(x) {sqrt(x*VOLO)}, color="blue") +
  geom_hline(yintercept = 0) +
  geom_vline(xintercept = 0) +
  geom_abline(intercept = a, slope = b) +
  geom_abline(intercept = mean(Wr.Vr$Wr)-mean(Wr.Vr$Vr), slope = 1) +
  geom_segment(aes(
      x     = mean(Wr.Vr$Vr)
    , y     = min(0, mean(Wr.Vr$Wr))
    , xend  = mean(Wr.Vr$Vr)
    , yend  = max(0, mean(Wr.Vr$Wr))
  )
  , color = "green"
  ) +
  geom_segment(aes(
      x     = min(0, mean(Wr.Vr$Vr))
    , y     = mean(Wr.Vr$Wr)
    , xend  = max(0, mean(Wr.Vr$Vr))
    , yend  = mean(Wr.Vr$Wr)
  )
  , color = "green"
  )  +
  lims(x=c(min(0, Wr.Vr$Vr, Wr.Vr$Wrei), max(Wr.Vr$Vr, Wr.Vr$Wrei)),
       y=c(min(0, Wr.Vr$Wr, Wr.Vr$Wrei), max(Wr.Vr$Wr, Wr.Vr$Wri))
  ) +
  labs(
         x = expression(V[r])
       , y = expression(W[r])
       , title = expression(paste(W[r]-V[r] , " Graph"))
       ) +
  theme_bw()
#> Warning: All aesthetics have length 1, but the data has 2 rows.
#> ℹ Please consider using `annotate()` or provide this layer with data containing
#>   a single row.
#> Warning: All aesthetics have length 1, but the data has 2 rows.
#> ℹ Please consider using `annotate()` or provide this layer with data containing
#>   a single row.
#> Warning: NaNs produced
#> Warning: Removed 11 rows containing missing values or values outside the scale range
#> (`geom_function()`).
