DiallelPower() estimates by simulation the power of Griffing's \(F\) tests of gca, sca and reciprocal
effects for numbers of replicates, so that the size of a diallel experiment can be planned.
Usage
DiallelPower(
  Parents,
  Method,
  Rep,
  Model = 1,
  gca,
  sca,
  rec = 0,
  Error,
  nsim = 500,
  alpha = 0.05,
  seed = NULL
)

# S3 method for class 'da_power'
plot(x, ...)
Arguments
- Parents
number of parents \(P \geq 3\).
- Method
Griffing's method,
1to4: which crosses are grown.- Rep
vector of numbers of replicates to compare.
- Model
1(fixed effects) or2(random effects): which tests.- gca, sca, rec
standard deviations of the gca, sca and reciprocal effects.
- Error
standard deviation of the plot errors \(\sigma\).
- nsim
number of simulated data sets for each number of replicates (default
500).- alpha
level of the tests (default
0.05).- seed
seed of the random numbers, or
NULL(default) to leave the generator as it is.- x
a
da_powerobject.- ...
unused.
Value
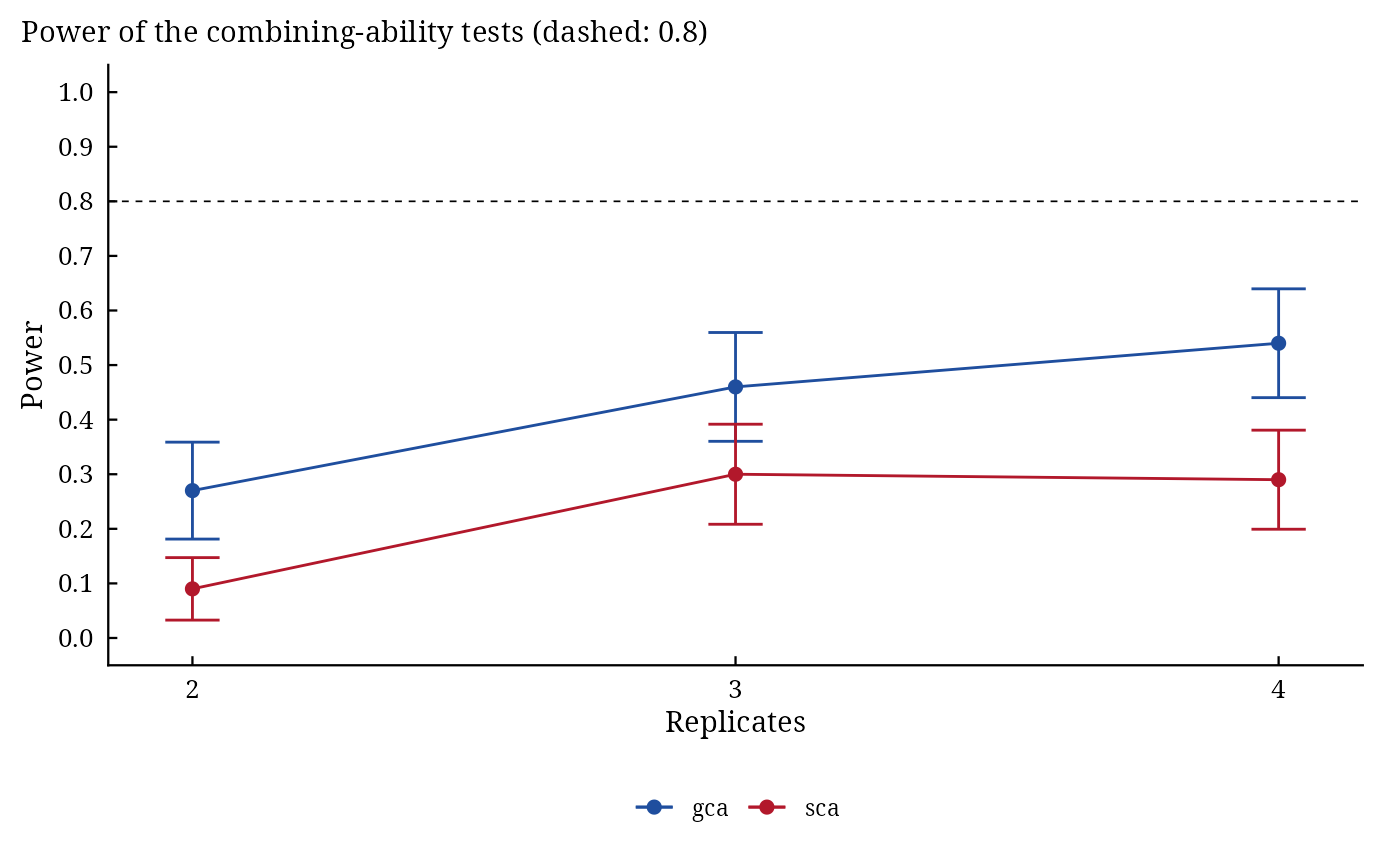
A data.table of class c("da_power", ...): columns Rep, Source (gca, sca,
reciprocals), Power and SE; plot() draws the power curves.
Details
For every number of replicates in Rep, nsim data sets are drawn with DiallelSim and
analysed with Griffing's closed forms; the power is the share of data sets whose test is significant at level
alpha, with its Monte Carlo standard error \(\sqrt{\hat{p}(1 - \hat{p})/n_{sim}}\).
The tests are those of Model: in Model 1 every line against the error, in Model 2 gca against sca. The
block effects do not change the tests and are left out.
See also
Other DiallelAnalysisR planning:
DiallelSim()
Author
Muhammad Yaseen (myaseen208@gmail.com)
Examples
pw <-
  DiallelPower(
      Parents = 6
    , Method  = 2
    , Rep     = 2:4
    , Model   = 1
    , gca     = 1
    , sca     = 1.5
    , rec     = 0
    , Error   = 4
    , nsim    = 100
    , alpha   = 0.05
    , seed    = 1
    )
pw
#>      Rep Source Power         SE
#>    <int> <char> <num>      <num>
#> 1:     2    gca  0.27 0.04439595
#> 2:     2    sca  0.09 0.02861818
#> 3:     3    gca  0.46 0.04983974
#> 4:     3    sca  0.30 0.04582576
#> 5:     4    gca  0.54 0.04983974
#> 6:     4    sca  0.29 0.04537621
plot(pw)