\(\color{green}{\textit{Statistics:}}\) \(\color{green}{\textit{The Art & Science of}}\) \(\color{green}{\textit{Learning from Data}}\)
\(\color{green}{\textit{Muhammad Yaseen}}\)
\(\color{green}{\textit{}}\)
Introduction
Introduction
\(\color{green}{\textit{In God we trust,}}\) \(\color{green}{\textit{all others must bring data.}}\)
Introduction
\(\color{green}{\textit{In God we trust, all others must bring data.}}\)
(\(\color{black}{\textit{William E. Deming}}\))
\(\color{green}{\textit{Statistical thinking will one day be as necessary a}}\) \(\color{green}{\textit{qualification for efficient citizenship as the ability}}\) \(\color{green}{\textit{to read & write.}}\)
(\(\color{black}{\textit{H.G. Wells}}\))
Introduction
\(\color{green}{\textit{To call in the statistician after the experiment is}}\) \(\color{green}{\textit{done may be no more than asking him to perform}}\) \(\color{green}{\textit{a postmortem examination: he may be able to say}}\) \(\color{green}{\textit{what the experiment died of.}}\)
(\(\color{black}{\textit{R. A. Fisher}}\))
\(\color{green}{\textit{If all you have is a hammer, everything looks like}}\) \(\color{green}{\textit{a nail.}}\)
(\(\color{black}{\textit{Abraham Maslow}}\))
Introduction
Introduction
Introduction
Introduction
Introduction
Decision Review System
Medical Laboratory Test
Karachi Stock Exchange
Heavy Rain in Lahore
Flood in Pakistan 2010
Drought in Pakistan
Wheat Crop in Pakistan
Introduction
\(\color{red}{\text{Mathematics}}\) is the \(\color{red}{\text{language}}\) of \(\color{red}{\text{Science}}\)
- \(2 + 2 = 4\)
- \(0^{\circ}C = 32^{\circ}F\) (\(\color{blue}{\text{Paradox}}\))
- Every action has reaction of same extent but opposite direction. (\(\color{blue}{\text{Newton's Third Law}}\))
\(\color{green}{\text{Statistics}}\) is the science of \(\color{green}{\text{uncertainty}}\) and \(\color{green}{\text{variability}}\)
\(\color{green}{\text{Statistics}}\) is the \(\color{green}{\text{interpretation}}\) of \(\color{green}{\text{Science}}\)
- \(\color{green}{\text{D}}\)ata \(\color{green}{\text{D}}\)riven \(\color{green}{\text{D}}\)ecisions (\(\color{green}{\text{3Ds}}\))
Reasoning
- \(\color{green}{\text{Deduction:}}\)
Reasoning from \(\color{green}{\text{general}}\) to \(\color{green}{\text{particular}}\).
Man is mortal. → Every human being is mortal.
- \(\color{red}{\text{Induction:}}\)
- Reasoning from \(\color{red}{\text{particular}}\) to \(\color{red}{\text{general}}\).
Statistical Reasoning & Analysis
- \(\color{green}{\text{Statistics}}\) is the \(\color{green}{\text{science}}\) of \(\color{green}{\text{uncertainty}}\) & \(\color{green}{\text{variability}}\)
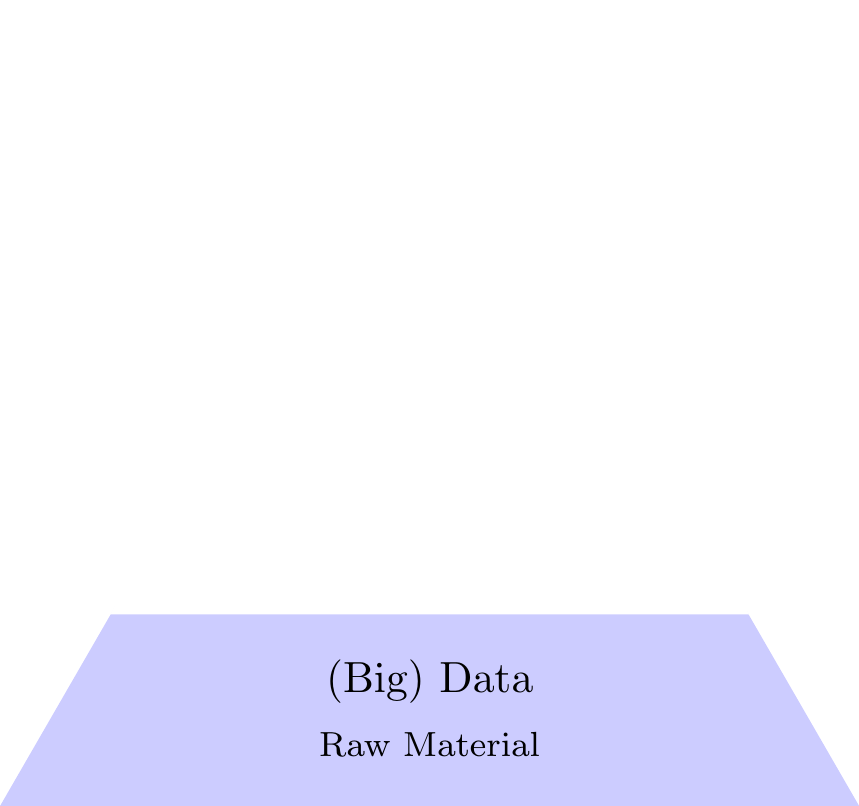
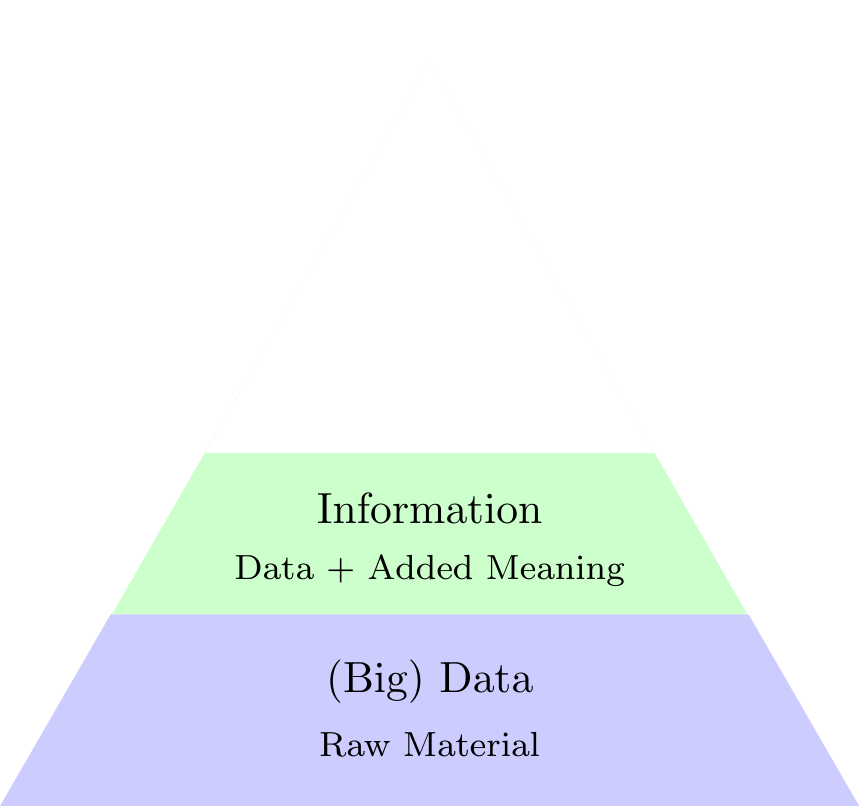
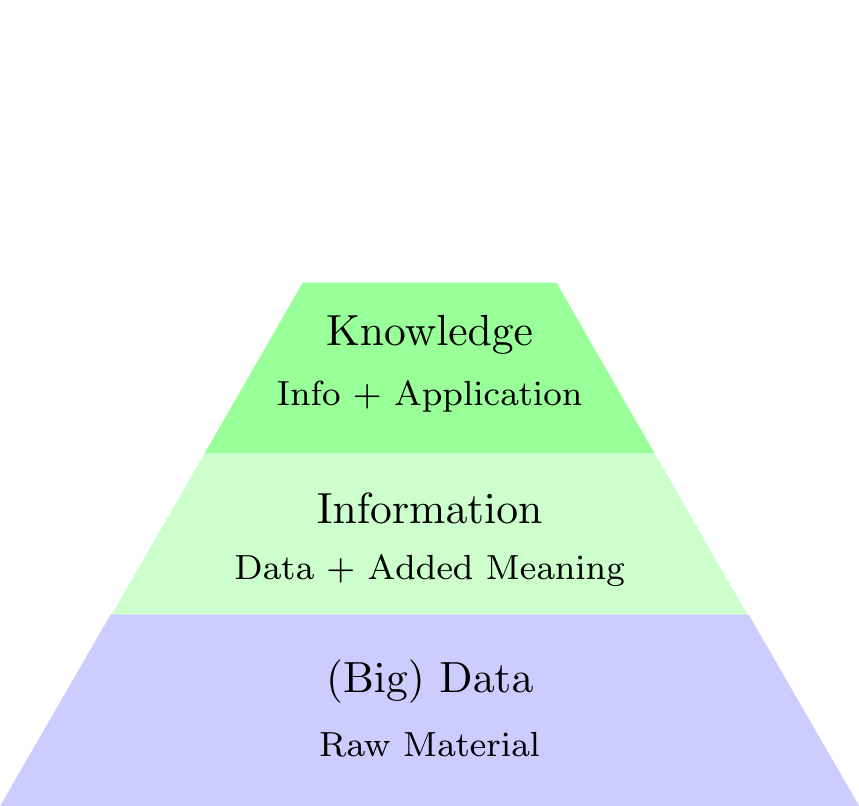
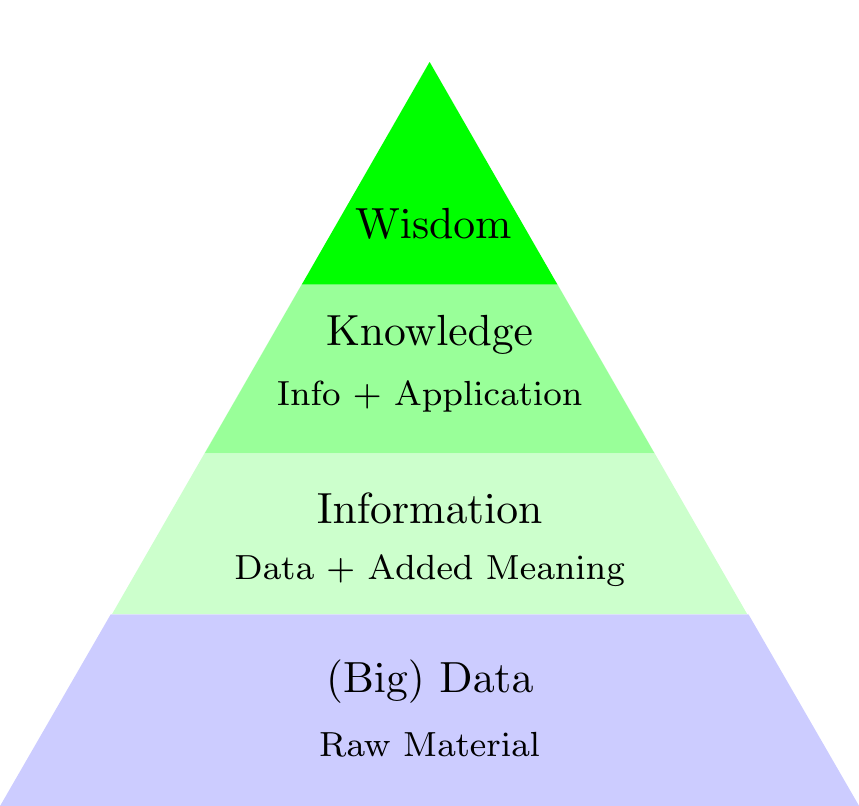
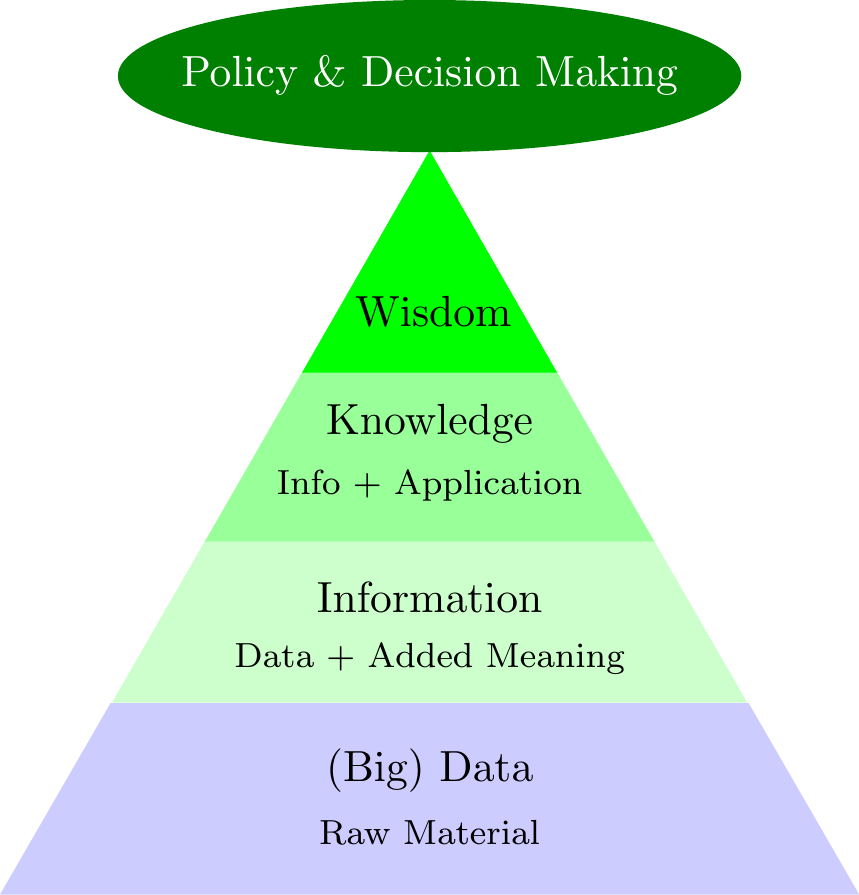
Turning \(\color{green}{\text{Data}}\) into \(\color{green}{\text{Information}}\)
- \(\color{green}{\text{Data}}\) → \(\color{green}{\text{Information}}\) → \(\color{green}{\text{Knowledge}}\) → \(\color{green}{\text{Wisdom}}\)
- \(\color{green}{\text{Statistics}}\) is the \(\color{green}{\text{Art}}\) and \(\color{green}{\text{Science}}\) of \(\color{green}{\text{learning}}\) from \(\color{green}{\text{Data}}\).
Variable
Variable
\(\color{red}{\text{Variable:}}\) A \(\color{green}{\text{characteristic}}\) that may \(\color{green}{\text{vary}}\) from \(\color{green}{\text{subject}}\) to \(\color{green}{\text{subject}}\)
\(\color{red}{\text{Variables}}\) are \(\color{green}{\text{denoted}}\) by \(\color{green}{\text{last}}\) \(\color{green}{\text{English}}\) \(\color{green}{\text{alphabets}}\) in \(\color{green}{\text{upper}}\) \(\color{green}{\text{case}}\)
\(\color{green}{\text{Different observations}}\) of a \(\color{red}{\text{variable}}\) are \(\color{green}{\text{characterized}}\) by \(\color{green}{\text{subscripts}}\)
Measurement & Measurement Scales
Measurement & Measurement Scales
Traffic Signal
Measurement & Measurement Scales
- \(\color{green}{\text{Measurement}}\)
- The process of assigning numbers or labels to objects or states in accordance with specific logically accepted rules.
- \(\color{green}{\text{Measurement Scales}}\)
- Data can be classified according to levels of measurement.
- The level of measurement of the data often dictates the calculations that can be done to summarize and present the data.
- It will also determine the statistical tests that should be performed.
Measurement & Measurement Scales
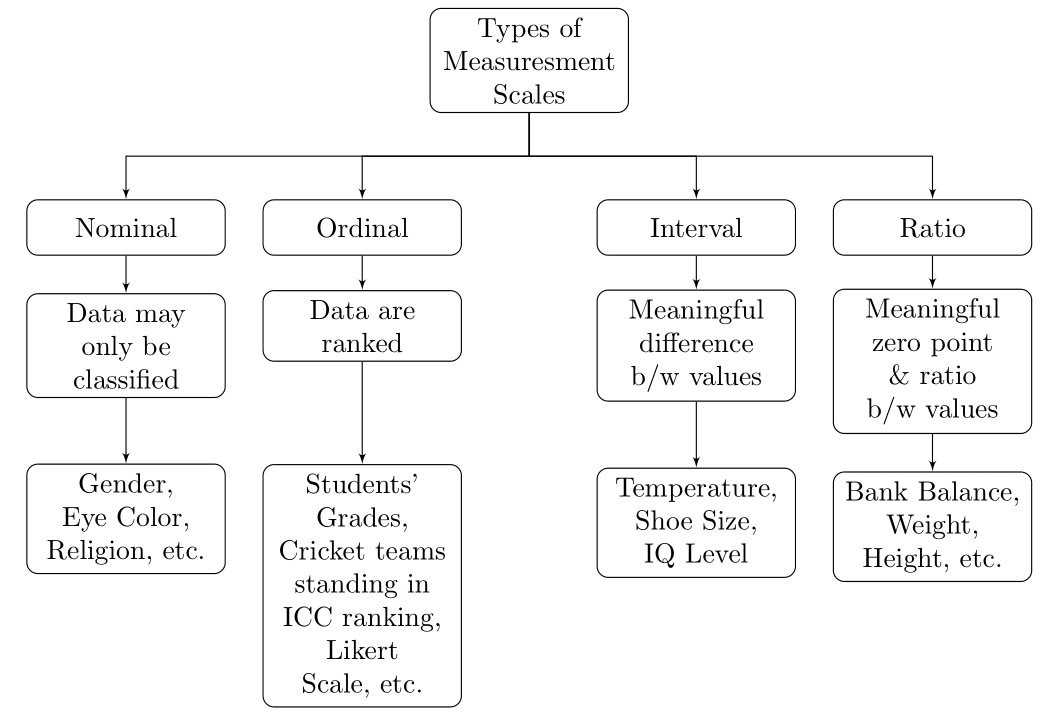
Measurement Scales
Types of Variables
Qualitative & Quantitative Variables
- \(\color{green}{\text{Qualitative}}\)
- Nominal or Ordinal variables
- \(\color{green}{\text{Quantitative}}\)
- Interval or Ratio variables
- Discrete
- Continuous
- Normal
- Non-Normal
- Interval or Ratio variables
Dependent & Independent Variables
- \(\color{green}{\text{Dependent Variable}}\)
- Variable influenced by other variable(s)
- \(\color{green}{\text{Independent Variable}}\)
- Variable influencing other variable(s)
Relationship b/w Variables
Dependent & Independent Variables
- \(\color{green}{\text{Expenditures & Income}}\)
- Expenditures are influenced by Income.
- \(\color{green}{\text{Dependent Variable:}}\) Expenditures
- \(\color{green}{\text{Independent Variable:}}\) Income
- Expenditures ← Income
- Expenditures are influenced by Income.
- \(\color{green}{\text{CGPA & Study Hours}}\)
- CGPA is influenced by Study Hours.
- \(\color{green}{\text{Dependent Variable:}}\) CGPA
- \(\color{green}{\text{Independent Variable:}}\) Study Hours
- CGPA ← Study Hours
- CGPA is influenced by Study Hours.
Dependent & Independent Variables
- \(\color{green}{\text{Landline Phone Bill & Number of Calls}}\)
- Landline Phone Bill is affected by Number of Calls made.
- \(\color{green}{\text{Dependent Variable:}}\) Landline Phone Bill
- \(\color{green}{\text{Independent Variable:}}\) No. of Calls
- Bill ← No. of Calls
- Landline Phone Bill is affected by Number of Calls made.
- \(\color{green}{\text{Crop Production & Amount of Fertilizer}}\)
- Crop Production is influenced by Amount of Fertilizer used.
- \(\color{green}{\text{Dependent Variable:}}\) Crop Production
- \(\color{green}{\text{Independent Variable:}}\) Amount of Fertilizer
- Crop Production ← Amount of Fertilizer
- Crop Production is influenced by Amount of Fertilizer used.
Types of Relationship
Mathematical Relationship
- \(\color{green}{\text{Mathematical Relationship}}\)
- \(\color{red}{\text{Exact Relationship}}\)
- \(Y = f\left(X\right)\)
- \(Y \mathrel{\color{red}\leftarrow} X\)
Mathematical Relationship
- \(\color{green}{\text{Relationship between Area and Radius of a Circle}}\)
- \(A = f\left(r\right)\)
- \(A = \pi r^{2}\)
- \(A \mathrel{\color{red}\leftarrow} r\)
- \(\color{green}{\text{Relationship between Landline Phone Bill and Number of Calls made}}\)
- \(\text{Bill} = f\left(\text{No. of Calls}\right)\)
- \(\text{Bill} \mathrel{\color{red}\leftarrow} \text{No. of Calls}\)
Statistical Relationship
- \(\color{green}{\text{Statistical Relationship}}\)
- \(\color{red}{\text{Inexact or Probabilistic Relationship}}\)
- \(Y = f\left(X\right)+\epsilon\)
- \(Y \mathrel{\color{red}\leftarrow} X\)
Statistical Relationship
- \(\color{green}{\text{Relationship between Expenditures and Income}}\)
- \(\text{Expenditures} = f\left(\text{Income}\right)+\epsilon\)
- \(\text{Expenditures} \mathrel{\color{red}\leftarrow} \text{Income}\)
- \(\color{green}{\text{Relationship between CGPA and Study Hours}}\)
- \(\text{CGPA} = f\left(\text{Study Hours}\right)+\epsilon\)
- \(\text{CGPA} \mathrel{\color{red}\leftarrow} \text{Study Hours}\)
Statistical Models
Models
\(\color{green}{\textit{All models are wrong,}}\) \(\color{green}{\textit{but some are useful.}}\)
Linear Model
- \(\color{green}{\text{Expenditures & Income}}\)
- \(\color{green}{\text{Expenditures are influenced by Income}}\)
- \(\text{Expenditures} \mathrel{\color{red}\leftarrow} \text{Income}\)
- \(\color{green}{\text{Expenditures & Gender}}\)
- \(\color{green}{\text{Expenditures are influenced by Gender}}\)
- \(\text{Expenditures} \mathrel{\color{red}\leftarrow} \text{Gender}\)
- \(\color{green}{\text{Expenditures, Income & Gender}}\)
- \(\color{green}{\text{Expenditures are influenced by Income & Gender}}\)
- \(\text{Expenditures} \mathrel{\color{red}\leftarrow} \text{Income} + \text{Gender}\)
Linear Model
- \(\color{green}{\text{CGPA & Study Hours}}\)
- \(\color{green}{\text{CGPA is influenced by Study Hours}}\)
- \(\text{CGPA} \mathrel{\color{red}\leftarrow} \text{Study Hours}\)
- \(\color{green}{\text{CGPA & Gender}}\)
- \(\color{green}{\text{CGPA is influenced by Gender}}\)
- \(\text{CGPA} \mathrel{\color{red}\leftarrow} \text{Gender}\)
- \(\color{green}{\text{CGPA, Study Hours & Gender}}\)
- \(\color{green}{\text{CGPA is influenced by Study Hours & Gender}}\)
- \(\text{CGPA} \mathrel{\color{red}\leftarrow} \text{Study Hours} + \text{Gender}\)
Linear Model
- \(\color{green}{\text{Weight Gain & Intake}}\)
- \(\color{green}{\text{Weight Gain is influenced by Intake}}\)
- \(\text{Weight Gain} \mathrel{\color{red}\leftarrow} \text{Intake}\)
- \(\color{green}{\text{Weight Gain & Feed Type}}\)
- \(\color{green}{\text{Weight Gain is influenced by Feed Type}}\)
- \(\text{Weight Gain} \mathrel{\color{red}\leftarrow} \text{Feed Type}\)
- \(\color{green}{\text{Weight Gain, Intake & Feed Type}}\)
- \(\color{green}{\text{Weight Gain is influenced by Intake & Feed Type}}\)
- \(\text{Weight Gain} \mathrel{\color{red}\leftarrow} \text{Intake} + \text{Feed Type}\)
Linear Model
- \(\color{green}{\text{Yield & Amount of Fertilizer}}\)
- \(\color{green}{\text{Yield of a crop is influenced by Amount of Fertilizer}}\)
- \(\text{Yield} \mathrel{\color{red}\leftarrow} \text{Amount of Fertilizer}\)
- \(\color{green}{\text{Yield & Varieties}}\)
- \(\color{green}{\text{Yield of a crop is influenced by Varieties}}\)
- \(\text{Yield} \mathrel{\color{red}\leftarrow} \text{Varieties}\)
- \(\color{green}{\text{Yield Amount of Fertilizer & Varieties}}\)
- \(\color{green}{\text{Yield of a crop is influenced by Amount of Fertilizer & Varieties}}\)
- \(\text{Yield} \mathrel{\color{red}\leftarrow} \text{Amount of Fertilizer} + \text{Varieties}\)
Regression Model
Regression Model
- \(\color{green}{\text{Quantify the dependency of a Normal variable on}}\) \(\color{green}{\text{one or more quantitative variable(s)}}\)
Regression Model
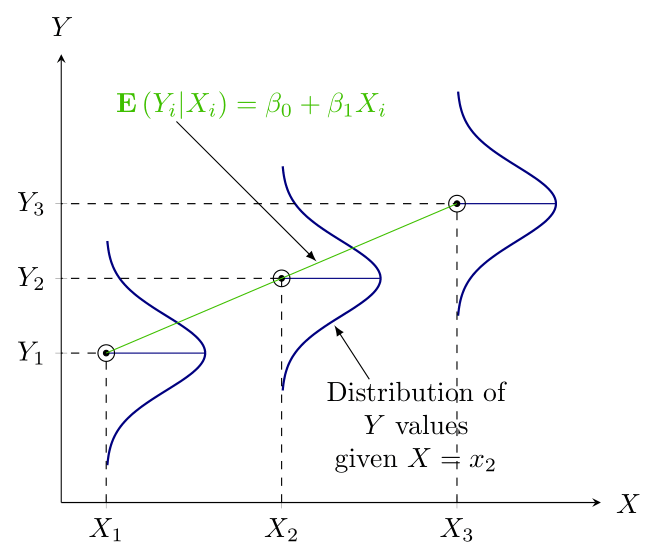
Population Regression Function
ANOVA Model
ANOVA Model
- \(\color{green}{\text{Comparing means of Normal dependent variable}}\) \(\color{green}{\text{for levels of different factors}}\)
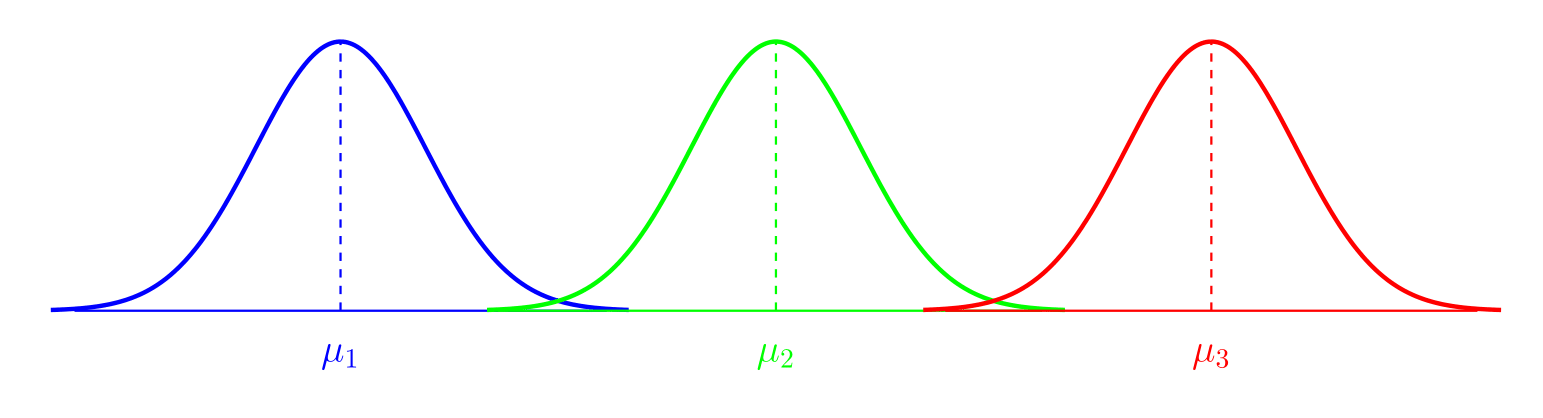
ANOVA Model
ANCOVA Model
ANCOVA Model
- \(\color{green}{\text{Quantify the dependency of a Normal variable on}}\) \(\color{green}{\text{one or more quantitative variable(s)}}\)
- \(\color{green}{\text{Comparing means of Normal dependent variable}}\) \(\color{green}{\text{for levels of different factors}}\)
ANCOVA Model
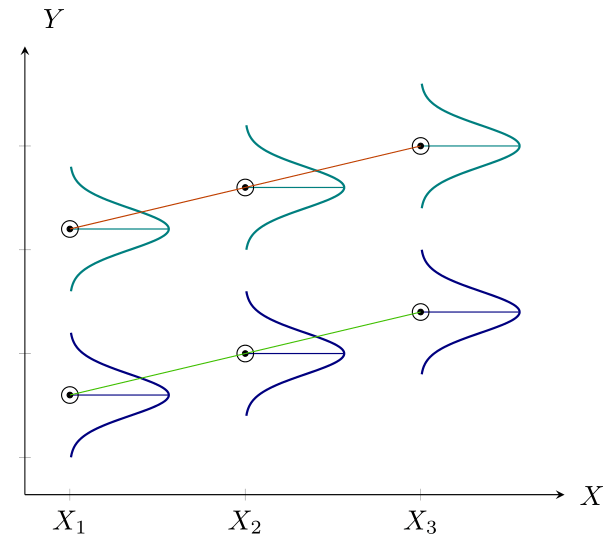
ANCOVA Model
Treatment Structure
Treatment Structure
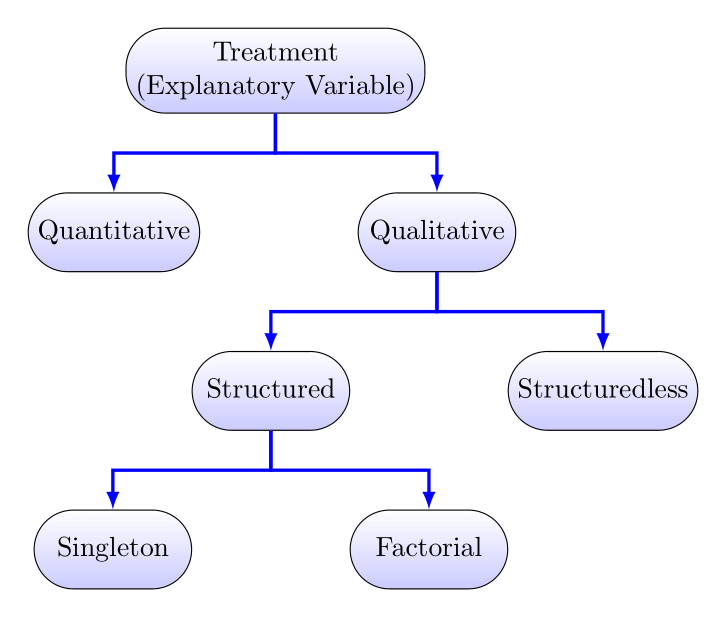
Treatment Structure
Treatment Structure
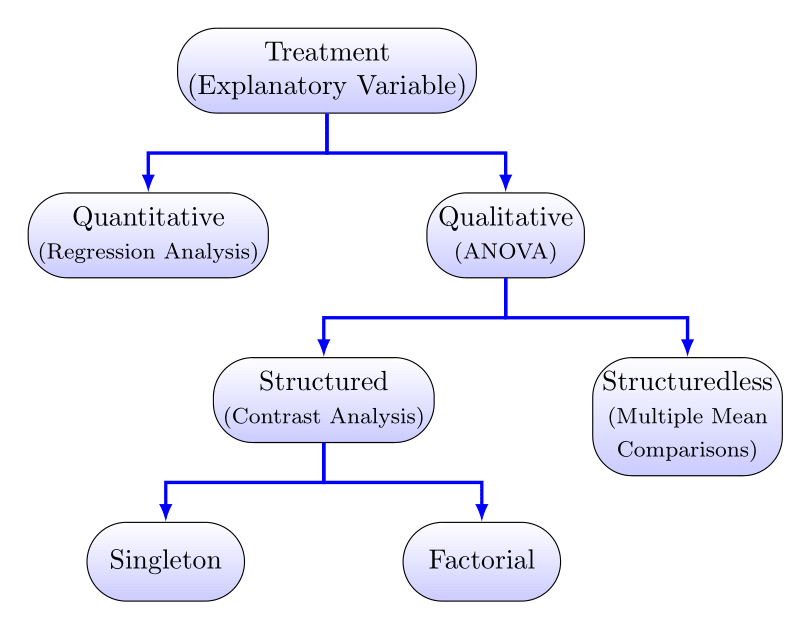
Treatment Structure
References
Fox, J. (2015). Applied Regression Analysis & Generalized Linear Models. SAGE Publications, Inc.
McCulloch, C. E., S. R. Searle, and J. M. Neuhaus (2008). Generalized, Linear, & Mixed Models. John Wiley & Sons.
Pezzullo, J. C. (2018). Biostatistics for Dummies. John Wiley & Sons, Inc.
R Core Team (2022). R: A Language & Environment for Statistical Computing. R Foundation for Statistical Computing. Vienna, Austria. URL: http://www.R-project.org/.
References (Cont’d…)
Searle, S. R. and M. H. J. Gruber (2016). Linear Models. John Wiley & Sons.
Sullivan, L. M. (2018). Essentials of Biostatistics in Public Health. Jones & Bartlett Learning.
Triola, M. F. (2018). Elementary Statistics. Pearson Education, Inc.
Triola, M. M., M. F. Triola, and J. Roy (2018). Biostatistics for the Biological & Health Sciences. Pearson Education, Inc.
\(\color{green}{\textit{Muhammad Yaseen, PhD (Statistics, UNL-USA)}}\), https://myaseen208.com