Batting Performance of Babar Azam and Virat Kohli
A comparative data analysis of Test batting records for Babar Azam and Virat Kohli using R, examining performance by year, opposition, and innings.
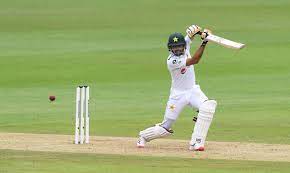
Test Batting Performance of Babar Azam
Overall Performance
Mat: Number of Matches played
Inns: Number of Innings played
NO: Number of NOT OUT
Runs: Runs scored
HS: Highest Runs Scored
Ave: Average
BF: Balls Faced
SR: Strike Rate
Hundreds: Number of Hundreds Scored
Fifties: Number of Fifties Scored
Fours: Number of Fours hitted
Sixes: Number of Sixes hitted
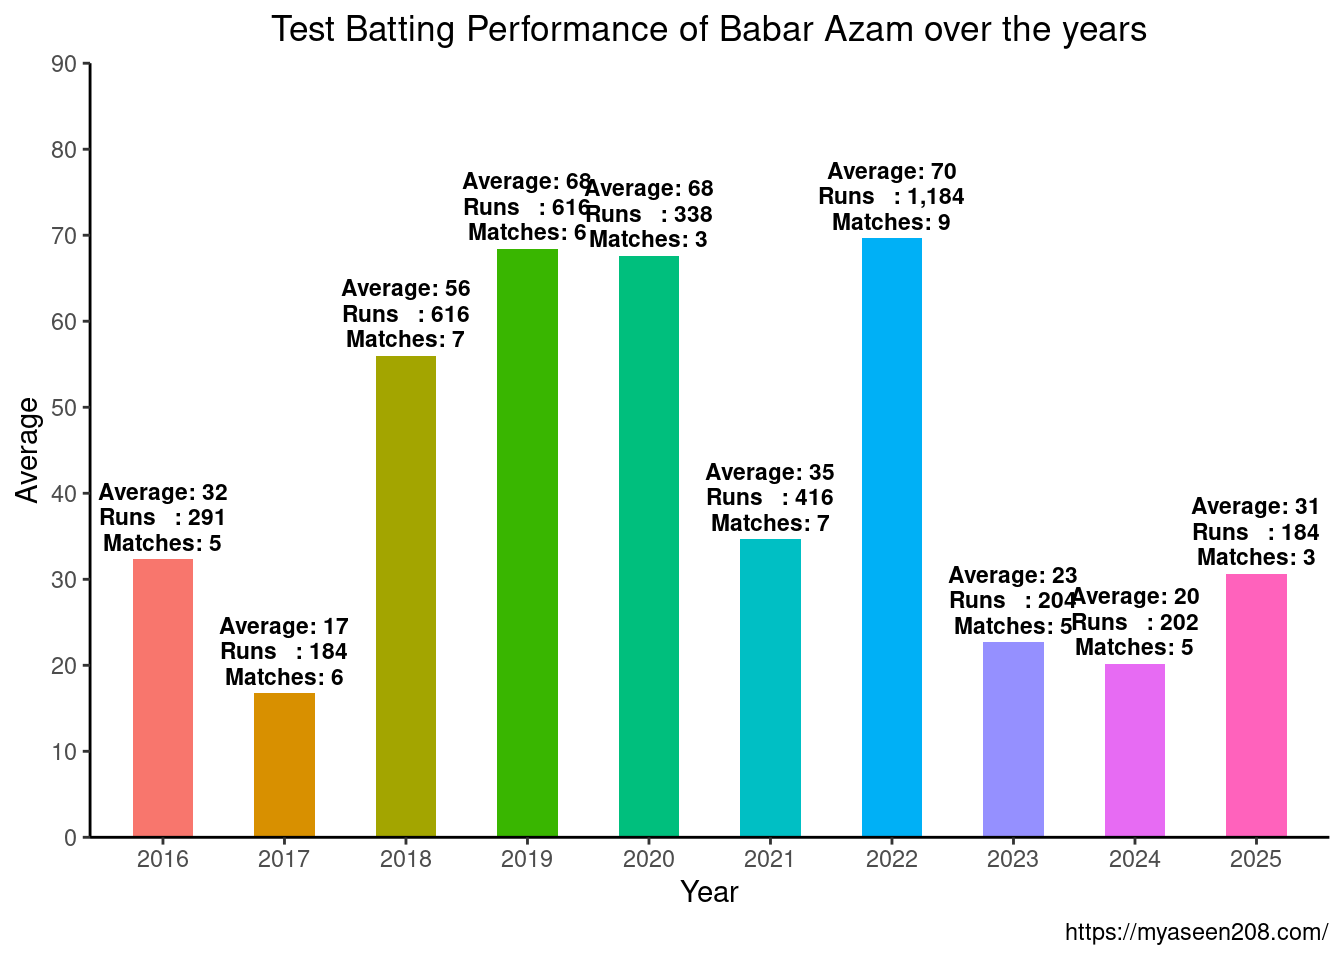
Performance by Years
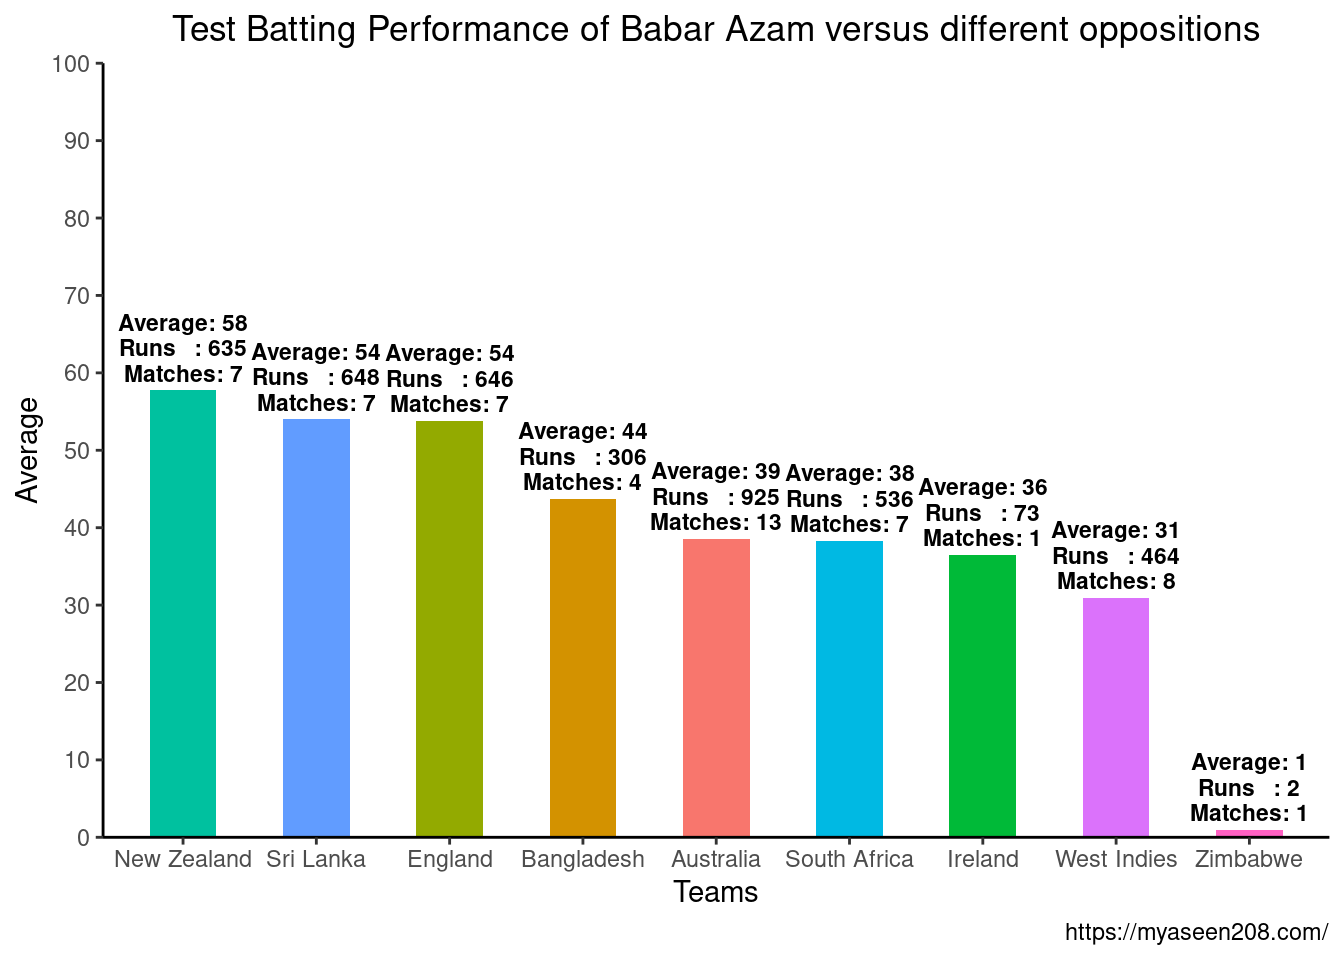
Performance versus different oppositions
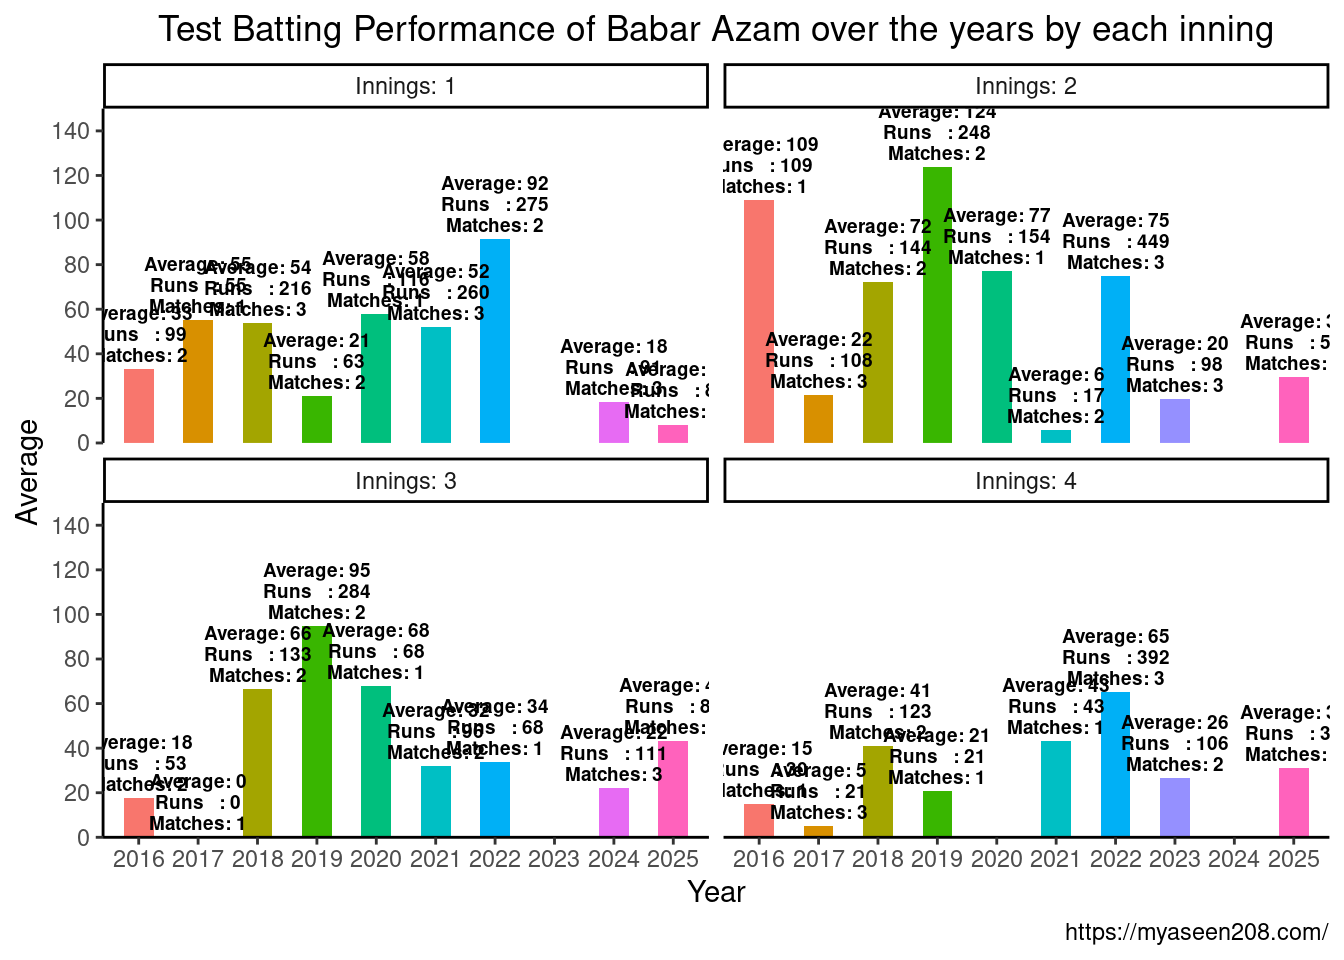
Performance by Years and Innings
Test Batting Performance of Virat Kohli
Overall Performance
Mat: Number of Matches played
Inns: Number of Innings played
NO: Number of NOT OUT
Runs: Runs scored
HS: Highest Runs Scored
Ave: Average
BF: Balls Faced
SR: Strike Rate
Hundreds: Number of Hundreds Scored
Fifties: Number of Fifties Scored
Fours: Number of Fours hitted
Sixes: Number of Sixes hitted
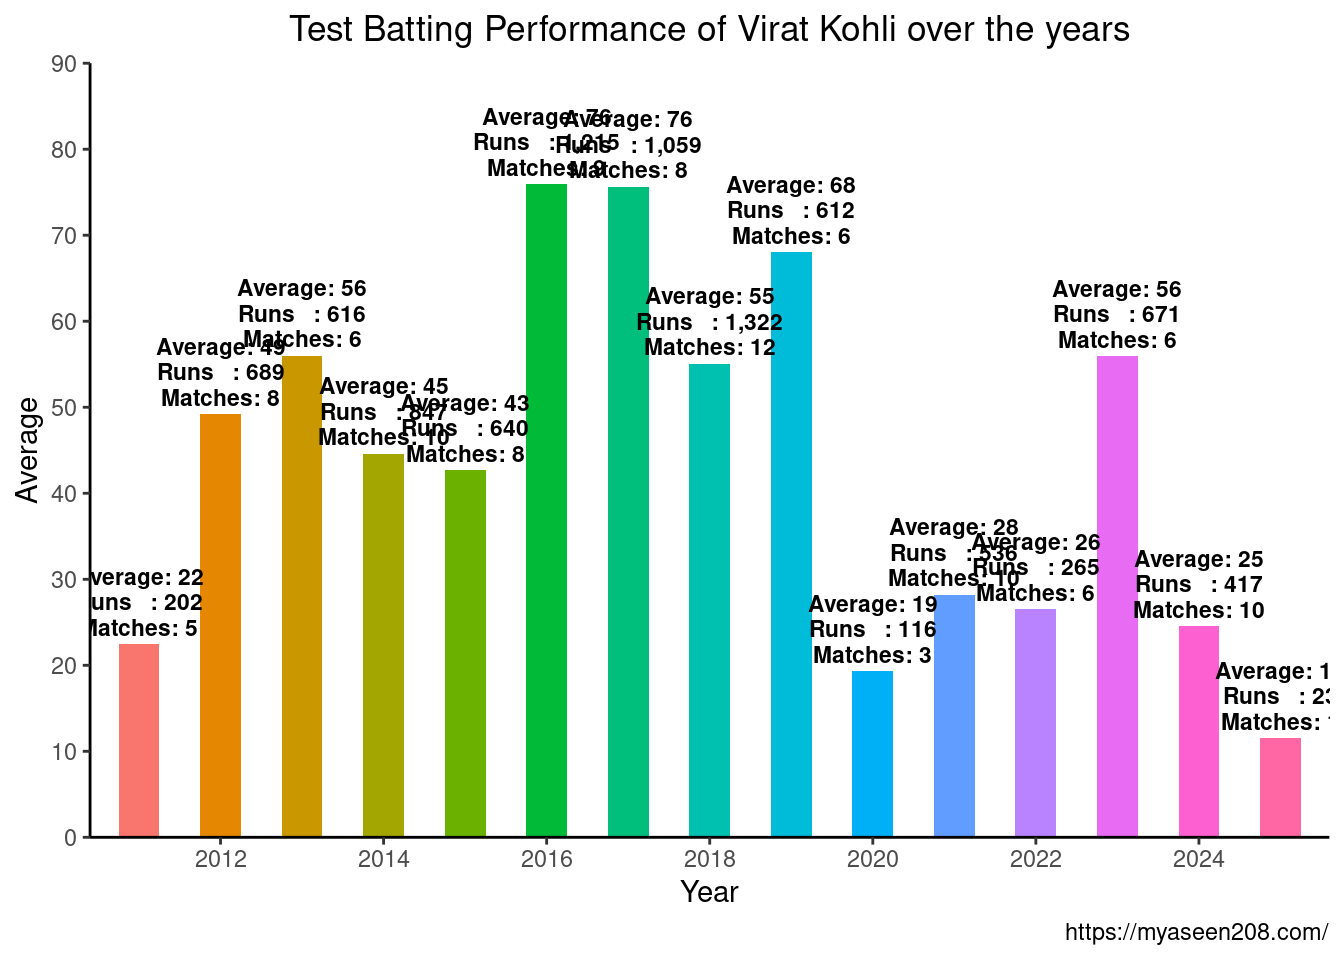
Performance by Years
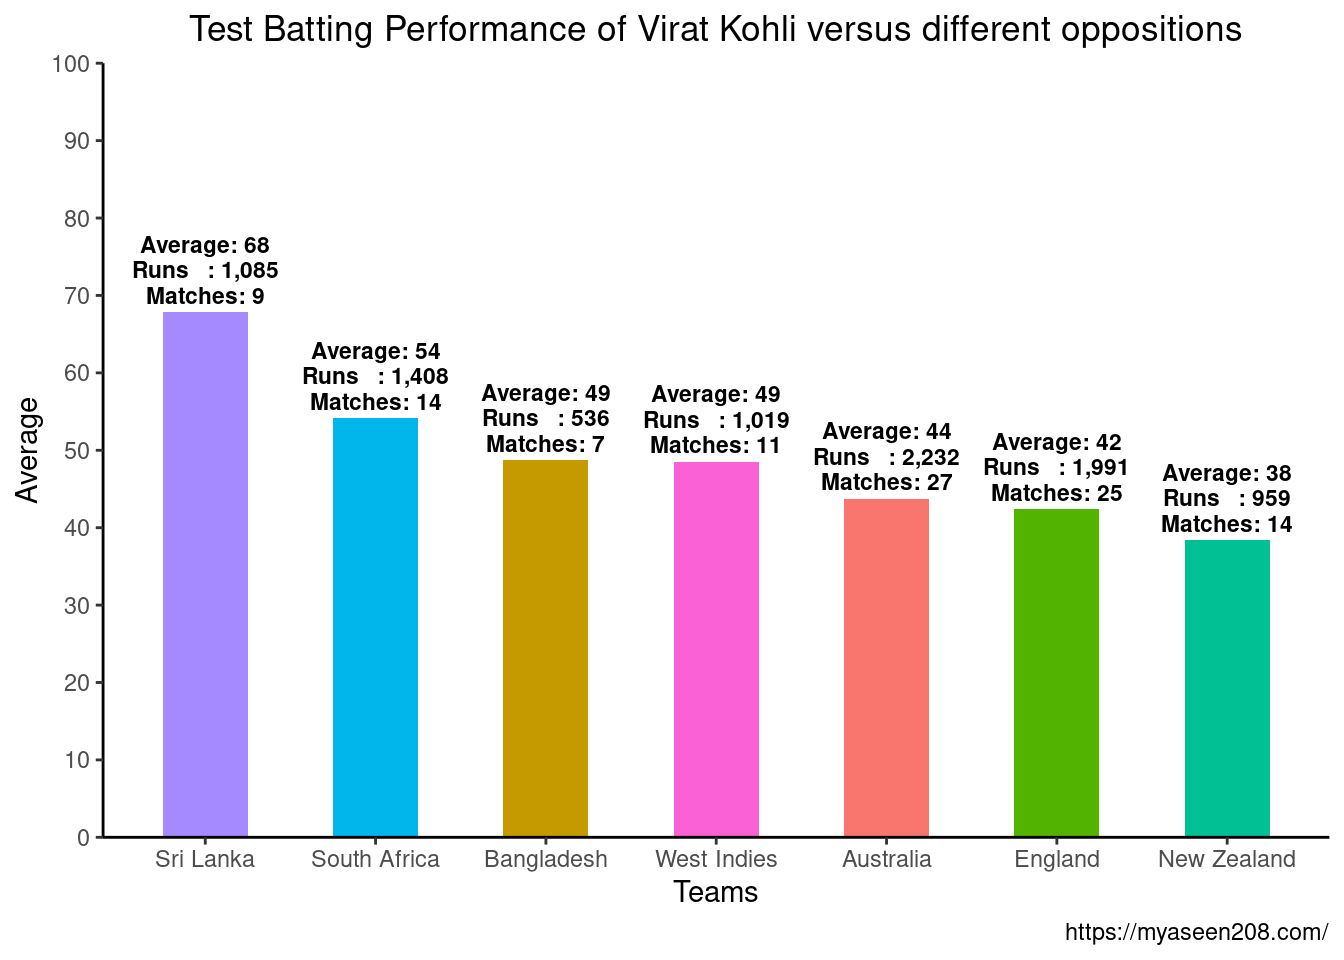
Performance versus different oppositions
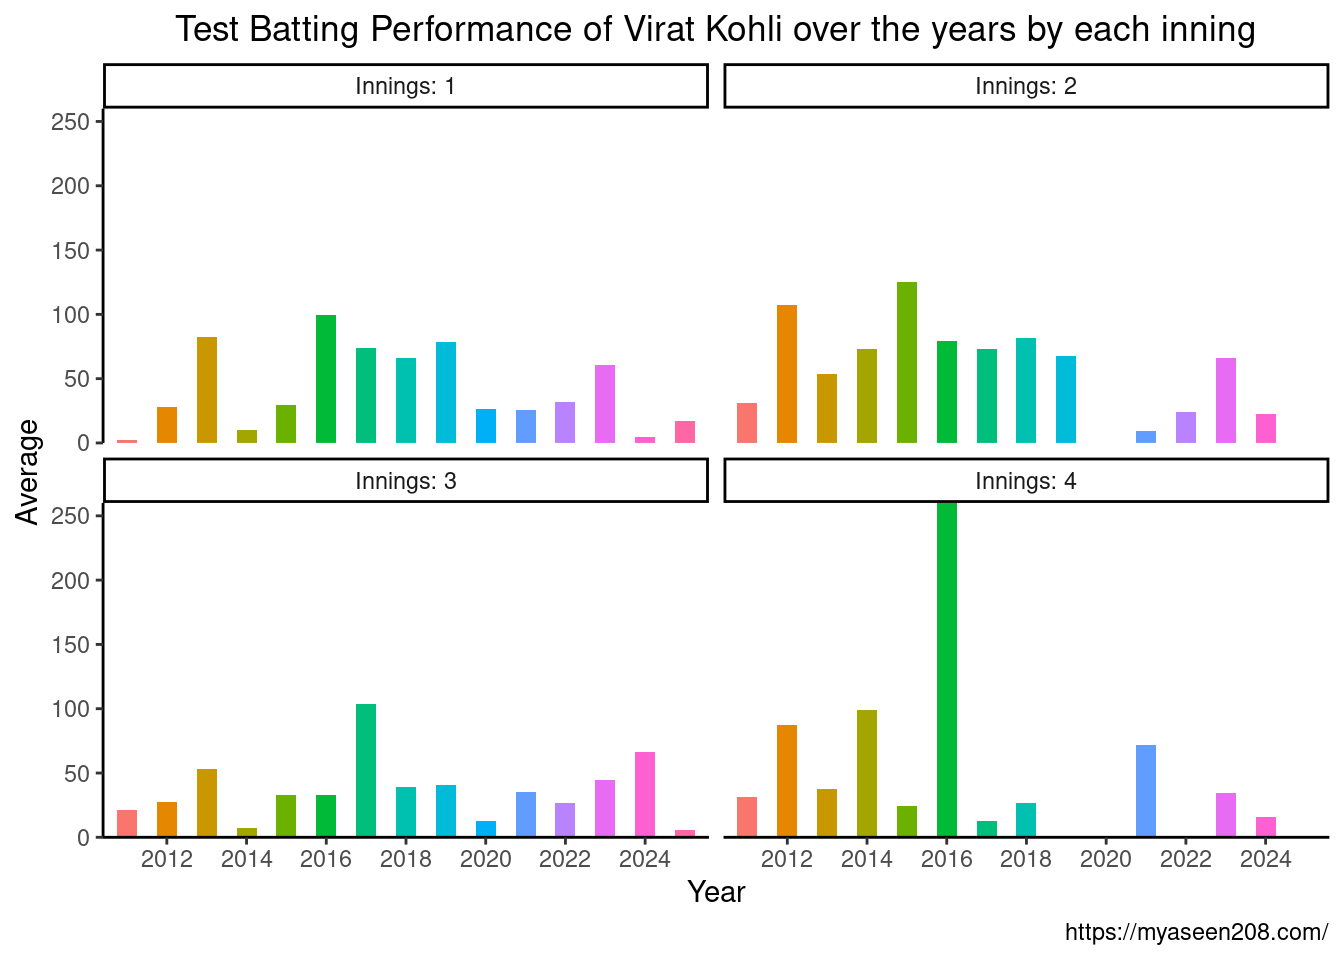
Performance by Years and Innings
Citation
BibTeX citation:
@online{yaseen2025,
  author = {Yaseen, Muhammad},
  title = {Batting {Performance} of {Babar} {Azam} and {Virat} {Kohli}},
  date = {2025-04-04},
  url = {https://myaseen208.com/blogs/2025-04-04_Cricket/},
  langid = {en}
}
For attribution, please cite this work as:
Yaseen, Muhammad. 2025. “Batting Performance of Babar Azam and
Virat Kohli.” April 4. https://myaseen208.com/blogs/2025-04-04_Cricket/.