Bayesian Estimation of Genotype by Environment Interaction Model
bayes_ammi.RdBayesian estimation method of linear–bilinear models for Genotype by Environment Interaction Model
References
Perez-Elizalde, S., Jarquin, D., and Crossa, J. (2011) A General Bayesian Estimation Method of Linear–Bilinear Models Applied to Plant Breeding Trials With Genotype × Environment Interaction. Journal of Agricultural, Biological, and Environmental Statistics, 17, 15–37. (doi:10.1007/s13253-011-0063-9)
Author
Muhammad Yaseen (myaseen208@gmail.com)
Diego Jarquin (diego.jarquin@gmail.com)
Sergio Perez-Elizalde (sergiop@colpos.mx)
Juan Burgueño (j.burgueno@cgiar.org)
Jose Crossa (j.crossa@cgiar.org)
Examples
library(baystability)
data(cultivo2008)
fm1 <-
ge_ammi(
.data = cultivo2008
, .y = y
, .gen = entry
, .env = site
, .rep = rep
)
r0 <- fm1$g
c0 <- fm1$e
n0 <- fm1$Rep
k0 <- fm1$k
mu0 <- fm1$mu
sigma20 <- fm1$sigma2
tau0 <- fm1$tau
tao0 <- fm1$tao
delta0 <- fm1$delta
lambdas0 <- fm1$lambdas
alphas0 <- fm1$alphas
gammas0 <- fm1$gammas
ge_means0 <- fm1$ge_means$ge_means
data(cultivo2008)
fm2 <-
ge_ammi(
.data = cultivo2009
, .y = y
, .gen = entry
, .env = site
, .rep = rep
)
k <- fm2$k
alphasa <- fm2$alphas
gammasa <- fm2$gammas
alphas1 <- tibble::as_tibble(fm2$alphas)
#> Warning: The `x` argument of `as_tibble.matrix()` must have unique column names if
#> `.name_repair` is omitted as of tibble 2.0.0.
#> ℹ Using compatibility `.name_repair`.
gammas1 <- tibble::as_tibble(fm2$gammas)
# Biplots OLS
library(ggplot2)
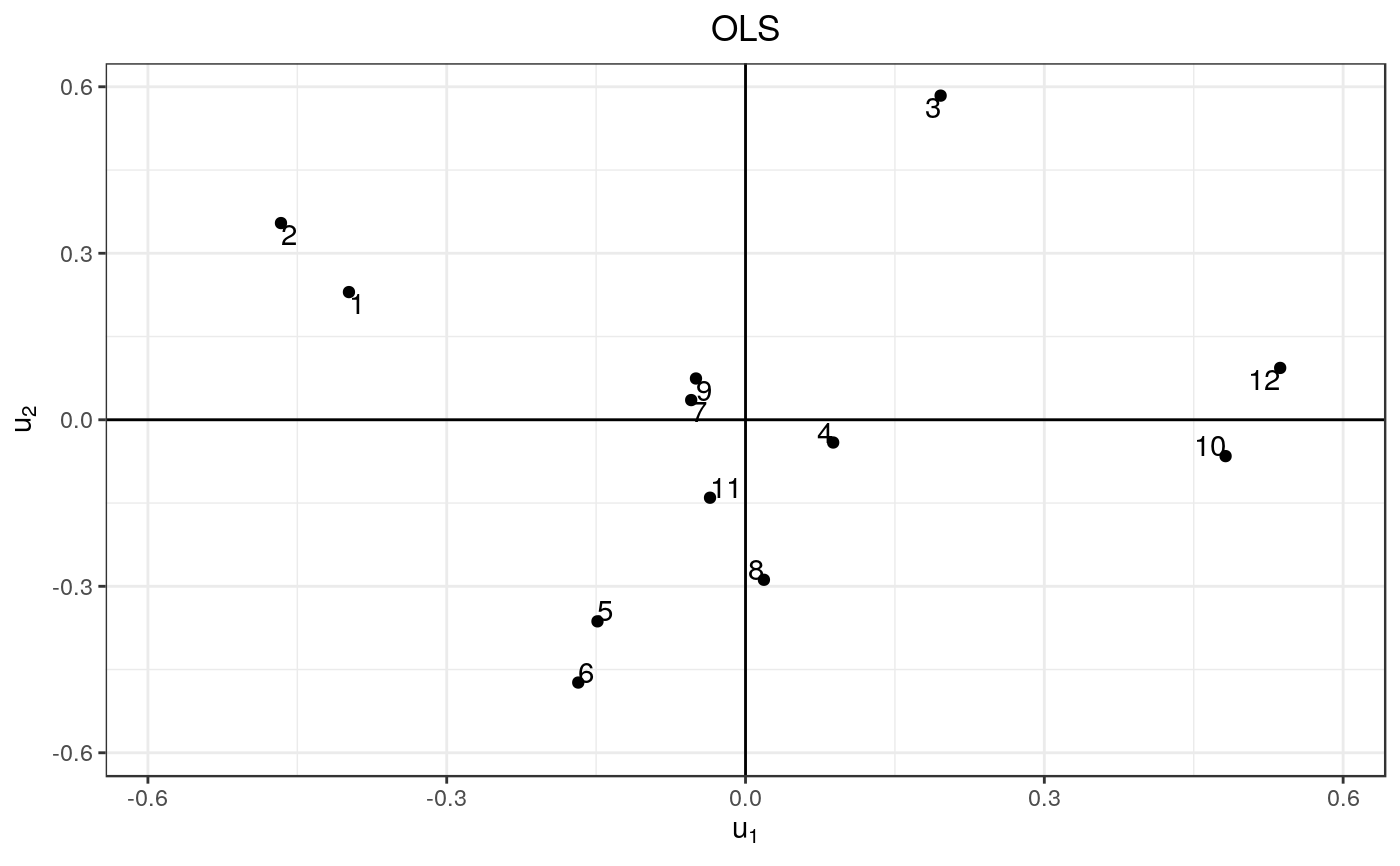
BiplotOLS1 <-
ggplot(data = alphas1, mapping = aes(x = V1, y = V2)) +
geom_point() +
geom_hline(yintercept = 0) +
geom_vline(xintercept = 0) +
geom_text(aes(label = 1:nrow(alphas1)), vjust = "inward", hjust = "inward") +
scale_x_continuous(
limits = c(-max(abs(c(range(alphas1[, 1:2]))))
, max(abs(c(range(alphas1[, 1:2])))))) +
scale_y_continuous(
limits = c(-max(abs(c(range(alphas1[, 1:2]))))
, max(abs(c(range(alphas1[, 1:2])))))) +
labs(title = "OLS", x = expression(u[1]), y = expression(u[2])) +
theme_bw() +
theme(plot.title = element_text(hjust = 0.5))
print(BiplotOLS1)
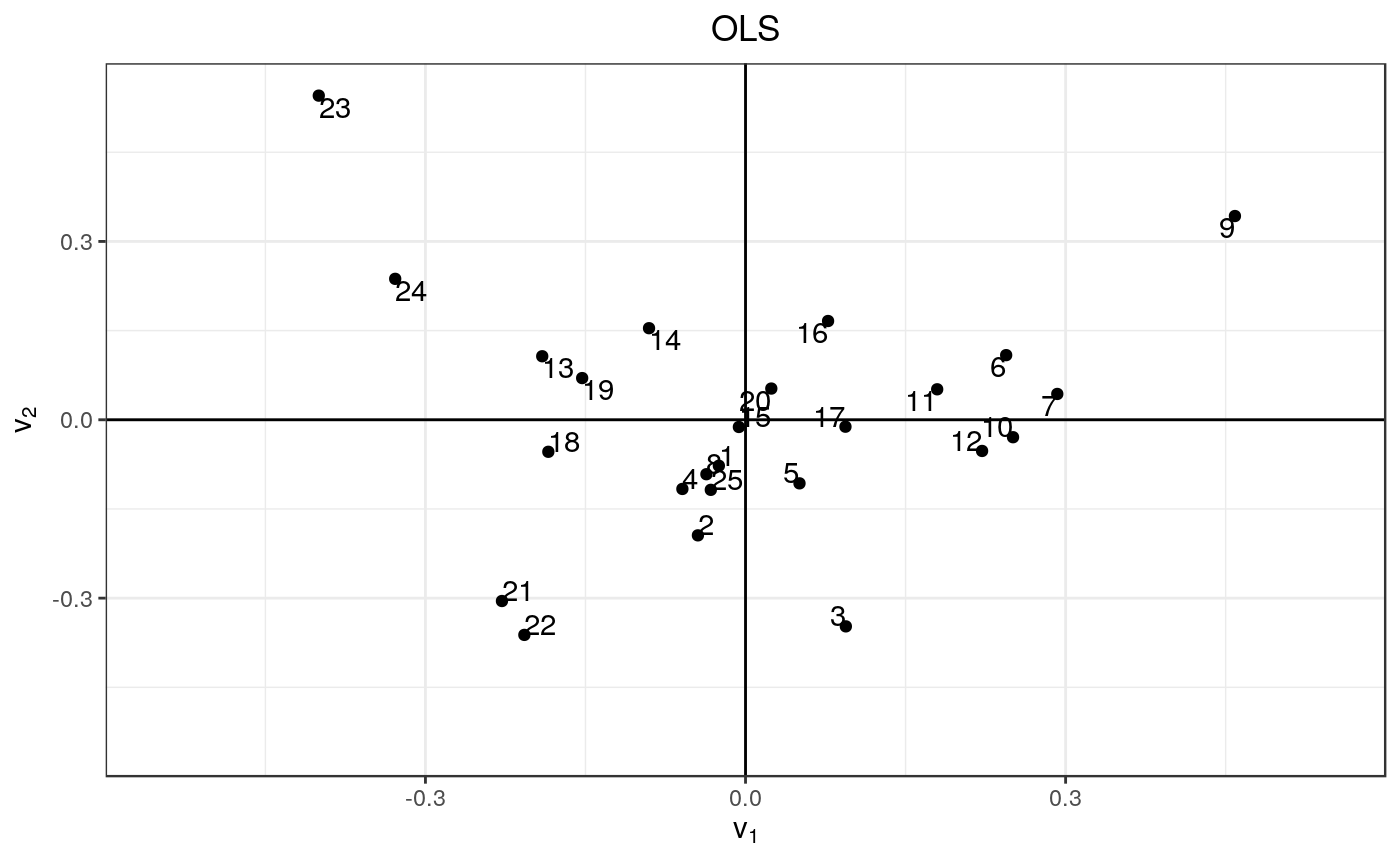
 BiplotOLS2 <-
ggplot(data = gammas1, mapping = aes(x = V1, y = V2)) +
geom_point() +
geom_hline(yintercept = 0) +
geom_vline(xintercept = 0) +
geom_text(aes(label = 1:nrow(gammas1)), vjust = "inward", hjust = "inward") +
scale_x_continuous(
limits = c(-max(abs(c(range(gammas1[, 1:2]))))
, max(abs(c(range(gammas1[, 1:2])))))) +
scale_y_continuous(
limits = c(-max(abs(c(range(gammas1[, 1:2]))))
, max(abs(c(range(gammas1[, 1:2])))))) +
labs(title = "OLS", x = expression(v[1]), y = expression(v[2])) +
theme_bw() +
theme(plot.title = element_text(hjust = 0.5))
print(BiplotOLS2)
BiplotOLS2 <-
ggplot(data = gammas1, mapping = aes(x = V1, y = V2)) +
geom_point() +
geom_hline(yintercept = 0) +
geom_vline(xintercept = 0) +
geom_text(aes(label = 1:nrow(gammas1)), vjust = "inward", hjust = "inward") +
scale_x_continuous(
limits = c(-max(abs(c(range(gammas1[, 1:2]))))
, max(abs(c(range(gammas1[, 1:2])))))) +
scale_y_continuous(
limits = c(-max(abs(c(range(gammas1[, 1:2]))))
, max(abs(c(range(gammas1[, 1:2])))))) +
labs(title = "OLS", x = expression(v[1]), y = expression(v[2])) +
theme_bw() +
theme(plot.title = element_text(hjust = 0.5))
print(BiplotOLS2)
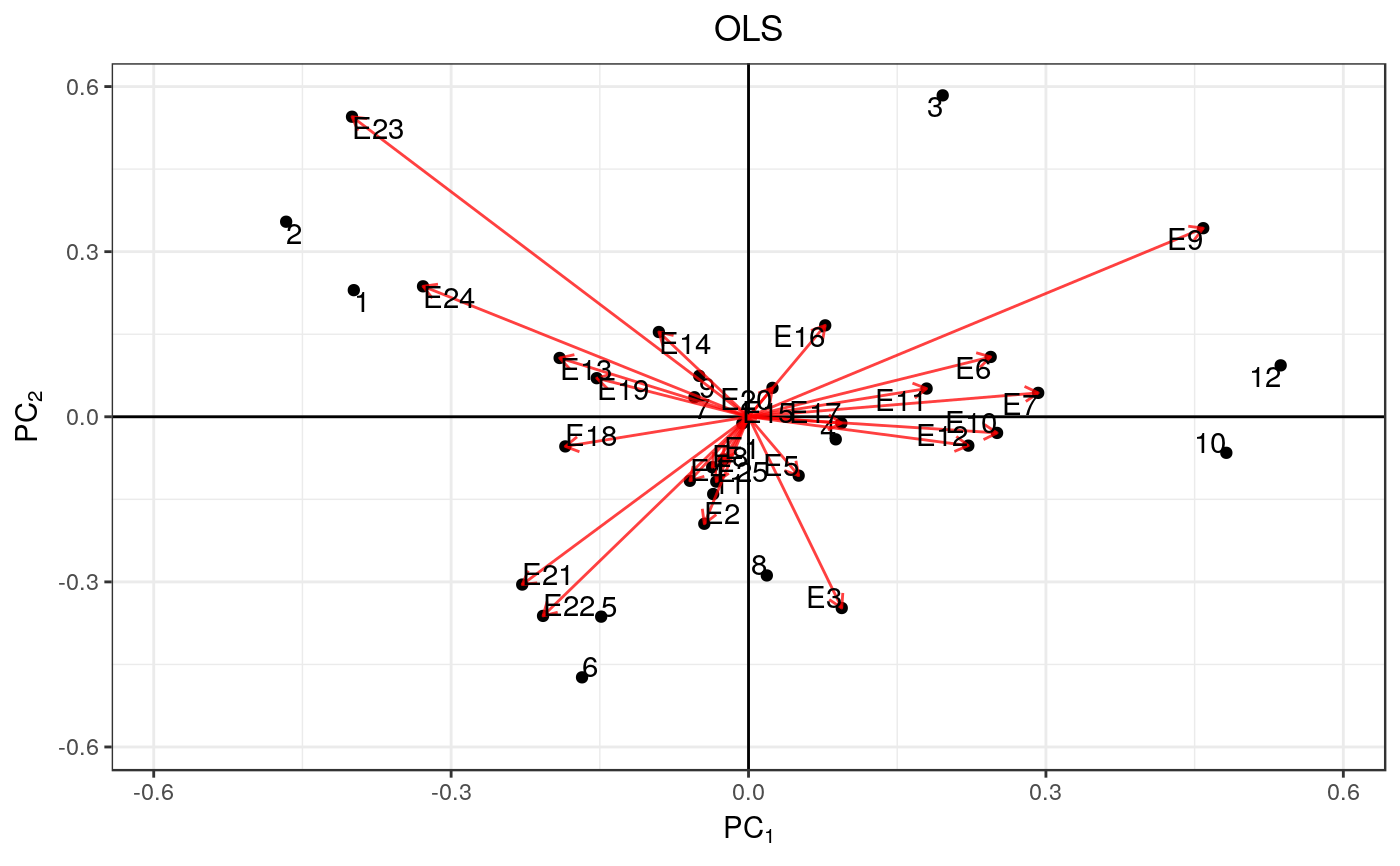
 BiplotOLS3 <-
ggplot(data = alphas1, mapping = aes(x = V1, y = V2)) +
geom_point() +
geom_hline(yintercept = 0) +
geom_vline(xintercept = 0) +
geom_text(aes(label = 1:nrow(alphas1)), vjust = "inward", hjust = "inward") +
geom_point(data = gammas1, mapping = aes(x = V1, y = V2)) +
geom_segment(data = gammas1, aes(x = 0, y = 0, xend = V1, yend = V2),
arrow = arrow(length = unit(0.2, "cm")), alpha = 0.75, color = "red") +
geom_text(data = gammas1,
aes(x = V1, y = V2, label = paste0("E", 1:nrow(gammasa)))
, vjust = "inward", hjust = "inward") +
scale_x_continuous(
limits = c(-max(abs(c(range(alphas1[, 1:2], gammas1[, 1:2]))))
, max(abs(c(range(alphas1[, 1:2], gammas1[, 1:2])))))) +
scale_y_continuous(
limits = c(-max(abs(c(range(alphas1[, 1:2], gammas1[, 1:2]))))
, max(abs(c(range(alphas1[, 1:2], gammas1[, 1:2])))))) +
labs(title = "OLS", x = expression(PC[1]), y = expression(PC[2])) +
theme_bw() +
theme(plot.title = element_text(hjust = 0.5))
print(BiplotOLS3)
BiplotOLS3 <-
ggplot(data = alphas1, mapping = aes(x = V1, y = V2)) +
geom_point() +
geom_hline(yintercept = 0) +
geom_vline(xintercept = 0) +
geom_text(aes(label = 1:nrow(alphas1)), vjust = "inward", hjust = "inward") +
geom_point(data = gammas1, mapping = aes(x = V1, y = V2)) +
geom_segment(data = gammas1, aes(x = 0, y = 0, xend = V1, yend = V2),
arrow = arrow(length = unit(0.2, "cm")), alpha = 0.75, color = "red") +
geom_text(data = gammas1,
aes(x = V1, y = V2, label = paste0("E", 1:nrow(gammasa)))
, vjust = "inward", hjust = "inward") +
scale_x_continuous(
limits = c(-max(abs(c(range(alphas1[, 1:2], gammas1[, 1:2]))))
, max(abs(c(range(alphas1[, 1:2], gammas1[, 1:2])))))) +
scale_y_continuous(
limits = c(-max(abs(c(range(alphas1[, 1:2], gammas1[, 1:2]))))
, max(abs(c(range(alphas1[, 1:2], gammas1[, 1:2])))))) +
labs(title = "OLS", x = expression(PC[1]), y = expression(PC[2])) +
theme_bw() +
theme(plot.title = element_text(hjust = 0.5))
print(BiplotOLS3)
 data(cultivo2009)
fm3 <-
bayes_ammi(
.data = cultivo2009
, .y = y
, .gen = entry
, .env = site
, .rep = rep
, .nIter = 200
)
#> Error in bayes_ammi.default(.data = cultivo2009, .y = y, .gen = entry, .env = site, .rep = rep, .nIter = 200): object 'n0' not found
Mean_Alphas <- fm3$Mean_Alphas
#> Error: object 'fm3' not found
Mean_Gammas <- fm3$Mean_Gammas
#> Error: object 'fm3' not found
# Biplots Bayesian
BiplotBayes1 <-
ggplot(data = Mean_Alphas, mapping = aes(x = V1, y = V2)) +
geom_point() +
geom_hline(yintercept = 0) +
geom_vline(xintercept = 0) +
geom_text(aes(label = 1:nrow(Mean_Alphas)),
vjust = "inward"
, hjust = "inward") +
scale_x_continuous(
limits = c(-max(abs(c(range(Mean_Alphas[, 1:2]))))
, max(abs(c(range(Mean_Alphas[, 1:2])))))) +
scale_y_continuous(
limits = c(-max(abs(c(range(Mean_Alphas[, 1:2]))))
, max(abs(c(range(Mean_Alphas[, 1:2])))))) +
labs(title = "Bayes", x = expression(u[1]), y = expression(u[2])) +
theme_bw() +
theme(plot.title = element_text(hjust = 0.5))
#> Error: object 'Mean_Alphas' not found
print(BiplotBayes1)
#> Error: object 'BiplotBayes1' not found
BiplotBayes2 <-
ggplot(data = Mean_Gammas, mapping = aes(x = V1, y = V2)) +
geom_point() +
geom_hline(yintercept = 0) +
geom_vline(xintercept = 0) +
geom_text(aes(label = 1:nrow(Mean_Gammas)), vjust = "inward", hjust = "inward") +
scale_x_continuous(
limits = c(-max(abs(c(range(Mean_Gammas[, 1:2]))))
, max(abs(c(range(Mean_Gammas[, 1:2])))))) +
scale_y_continuous(
limits = c(-max(abs(c(range(Mean_Gammas[, 1:2]))))
, max(abs(c(range(Mean_Gammas[, 1:2])))))) +
labs(title = "Bayes", x = expression(v[1]), y = expression(v[2])) +
theme_bw() +
theme(plot.title = element_text(hjust = 0.5))
#> Error: object 'Mean_Gammas' not found
print(BiplotBayes2)
#> Error: object 'BiplotBayes2' not found
BiplotBayes3 <-
ggplot(data = Mean_Alphas, mapping = aes(x = V1, y = V2)) +
geom_point() +
geom_hline(yintercept = 0) +
geom_vline(xintercept = 0) +
geom_text(aes(label = 1:nrow(Mean_Alphas)),
vjust = "inward", hjust = "inward") +
geom_point(data = Mean_Gammas, mapping = aes(x = V1, y = V2)) +
geom_segment(data = Mean_Gammas,
aes(x = 0, y = 0, xend = V1, yend = V2),
arrow = arrow(length = unit(0.2, "cm"))
, alpha = 0.75, color = "red") +
geom_text(data = Mean_Gammas,
aes(x = V1, y = V2,
label = paste0("E", 1:nrow(Mean_Gammas))),
vjust = "inward", hjust = "inward") +
scale_x_continuous(
limits = c(-max(abs(c(range(Mean_Alphas[, 1:2], Mean_Gammas[, 1:2]))))
, max(abs(c(range(Mean_Alphas[, 1:2], Mean_Gammas[, 1:2])))))) +
scale_y_continuous(
limits = c(-max(abs(c(range(Mean_Alphas[, 1:2], Mean_Gammas[, 1:2]))))
, max(abs(c(range(Mean_Alphas[, 1:2], Mean_Gammas[, 1:2])))))) +
labs(title = "Bayes", x = expression(PC[1]), y = expression(PC[2])) +
theme_bw() +
theme(plot.title = element_text(hjust = 0.5))
#> Error: object 'Mean_Alphas' not found
print(BiplotBayes3)
#> Error: object 'BiplotBayes3' not found
Plot1Mu <-
ggplot(data = fm3$mu1, mapping = aes(x = 1:nrow(fm3$mu1), y = mu)) +
geom_line(color = "blue") +
scale_x_continuous(labels = scales::comma) +
scale_y_continuous(labels = scales::comma) +
labs(y = expression(mu), x = "Iterations") +
theme_bw()
#> Error: object 'fm3' not found
print(Plot1Mu)
#> Error: object 'Plot1Mu' not found
Plot2Mu <-
ggplot(data = fm3$mu1, mapping = aes(mu)) +
geom_histogram() +
scale_x_continuous(labels = scales::comma) +
scale_y_continuous(labels = scales::comma) +
labs(y = "Frequency", x = expression(mu)) +
theme_bw()
#> Error: object 'fm3' not found
print(Plot2Mu)
#> Error: object 'Plot2Mu' not found
Plot1Sigma2 <-
ggplot(data = fm3$tau1, mapping = aes(x = 1:nrow(fm3$tau1), y = tau)) +
geom_line(color = "blue") +
scale_x_continuous(labels = scales::comma) +
scale_y_continuous(labels = scales::comma) +
labs(y = expression(sigma^2), x = "Iterations") +
theme_bw()
#> Error: object 'fm3' not found
print(Plot1Sigma2)
#> Error: object 'Plot1Sigma2' not found
Plot2Sigma2 <-
ggplot(data = fm3$tau1, mapping = aes(tau)) +
geom_histogram() +
scale_x_continuous(labels = scales::comma) +
scale_y_continuous(labels = scales::comma) +
labs(y = "Frequency", x = expression(sigma^2)) +
theme_bw()
#> Error: object 'fm3' not found
print(Plot2Sigma2)
#> Error: object 'Plot2Sigma2' not found
# Plot of Alphas
Plot1Alpha1 <-
ggplot(data = fm3$tao1, mapping = aes(x = 1:nrow(fm3$tao1), y = tao1)) +
geom_line(color = "blue") +
scale_x_continuous(labels = scales::comma) +
scale_y_continuous(labels = scales::comma) +
labs(y = expression(alpha[1]), x = "Iterations") +
theme_bw()
#> Error: object 'fm3' not found
print(Plot1Alpha1)
#> Error: object 'Plot1Alpha1' not found
Plot2Alpha1 <-
ggplot(data = fm3$tao1, mapping = aes(tao1)) +
geom_histogram() +
scale_x_continuous(labels = scales::comma) +
scale_y_continuous(labels = scales::comma) +
labs(y = "Frequency", x = expression(alpha[1])) +
theme_bw()
#> Error: object 'fm3' not found
print(Plot2Alpha1)
#> Error: object 'Plot2Alpha1' not found
Plot1Alpha2 <-
ggplot(data = fm3$tao1, mapping = aes(x = 1:nrow(fm3$tao1), y = tao2)) +
geom_line(color = "blue") +
scale_x_continuous(labels = scales::comma) +
scale_y_continuous(labels = scales::comma) +
labs(y = expression(alpha[2]), x = "Iterations") +
theme_bw()
#> Error: object 'fm3' not found
print(Plot1Alpha2)
#> Error: object 'Plot1Alpha2' not found
Plot2Alpha2 <-
ggplot(data = fm3$tao1, mapping = aes(tao2)) +
geom_histogram() +
scale_x_continuous(labels = scales::comma) +
scale_y_continuous(labels = scales::comma) +
labs(y = "Frequency", x = expression(alpha[2])) +
theme_bw()
#> Error: object 'fm3' not found
print(Plot2Alpha2)
#> Error: object 'Plot2Alpha2' not found
# Plot of Betas
Plot1Beta1 <-
ggplot(data = fm3$delta1, mapping = aes(x = 1:nrow(fm3$delta1), y = delta1)) +
geom_line(color = "blue") +
scale_x_continuous(labels = scales::comma) +
scale_y_continuous(labels = scales::comma) +
labs(y = expression(beta[1]), x = "Iterations") +
theme_bw()
#> Error: object 'fm3' not found
print(Plot1Beta1)
#> Error: object 'Plot1Beta1' not found
Plot2Beta1 <-
ggplot(data = fm3$delta1, mapping = aes(delta1)) +
geom_histogram() +
scale_x_continuous(labels = scales::comma) +
scale_y_continuous(labels = scales::comma) +
labs(y = "Frequency", x = expression(beta[1])) +
theme_bw()
#> Error: object 'fm3' not found
print(Plot2Beta1)
#> Error: object 'Plot2Beta1' not found
Plot1Beta2 <-
ggplot(data = fm3$delta1, mapping = aes(x = 1:nrow(fm3$delta1), y = delta2)) +
geom_line(color = "blue") +
scale_x_continuous(labels = scales::comma) +
scale_y_continuous(labels = scales::comma) +
labs(y = expression(beta[2]), x = "Iterations") +
theme_bw()
#> Error: object 'fm3' not found
print(Plot1Beta2)
#> Error: object 'Plot1Beta2' not found
Plot2Beta2 <-
ggplot(data = fm3$delta1, mapping = aes(delta2)) +
geom_histogram() +
scale_x_continuous(labels = scales::comma) +
scale_y_continuous(labels = scales::comma) +
labs(y = "Frequency", x = expression(beta[2])) +
theme_bw()
#> Error: object 'fm3' not found
print(Plot2Beta2)
#> Error: object 'Plot2Beta2' not found
Plot1Beta3 <-
ggplot(data = fm3$delta1, mapping = aes(x = 1:nrow(fm3$delta1), y = delta3)) +
geom_line(color = "blue") +
scale_x_continuous(labels = scales::comma) +
scale_y_continuous(labels = scales::comma) +
labs(y = expression(beta[3]), x = "Iterations") +
theme_bw()
#> Error: object 'fm3' not found
print(Plot1Beta3)
#> Error: object 'Plot1Beta3' not found
Plot2Beta3 <-
ggplot(data = fm3$delta1, mapping = aes(delta3)) +
geom_histogram() +
scale_x_continuous(labels = scales::comma) +
scale_y_continuous(labels = scales::comma) +
labs(y = "Frequency", x = expression(beta[3])) +
theme_bw()
#> Error: object 'fm3' not found
print(Plot2Beta3)
#> Error: object 'Plot2Beta3' not found
data(cultivo2009)
fm3 <-
bayes_ammi(
.data = cultivo2009
, .y = y
, .gen = entry
, .env = site
, .rep = rep
, .nIter = 200
)
#> Error in bayes_ammi.default(.data = cultivo2009, .y = y, .gen = entry, .env = site, .rep = rep, .nIter = 200): object 'n0' not found
Mean_Alphas <- fm3$Mean_Alphas
#> Error: object 'fm3' not found
Mean_Gammas <- fm3$Mean_Gammas
#> Error: object 'fm3' not found
# Biplots Bayesian
BiplotBayes1 <-
ggplot(data = Mean_Alphas, mapping = aes(x = V1, y = V2)) +
geom_point() +
geom_hline(yintercept = 0) +
geom_vline(xintercept = 0) +
geom_text(aes(label = 1:nrow(Mean_Alphas)),
vjust = "inward"
, hjust = "inward") +
scale_x_continuous(
limits = c(-max(abs(c(range(Mean_Alphas[, 1:2]))))
, max(abs(c(range(Mean_Alphas[, 1:2])))))) +
scale_y_continuous(
limits = c(-max(abs(c(range(Mean_Alphas[, 1:2]))))
, max(abs(c(range(Mean_Alphas[, 1:2])))))) +
labs(title = "Bayes", x = expression(u[1]), y = expression(u[2])) +
theme_bw() +
theme(plot.title = element_text(hjust = 0.5))
#> Error: object 'Mean_Alphas' not found
print(BiplotBayes1)
#> Error: object 'BiplotBayes1' not found
BiplotBayes2 <-
ggplot(data = Mean_Gammas, mapping = aes(x = V1, y = V2)) +
geom_point() +
geom_hline(yintercept = 0) +
geom_vline(xintercept = 0) +
geom_text(aes(label = 1:nrow(Mean_Gammas)), vjust = "inward", hjust = "inward") +
scale_x_continuous(
limits = c(-max(abs(c(range(Mean_Gammas[, 1:2]))))
, max(abs(c(range(Mean_Gammas[, 1:2])))))) +
scale_y_continuous(
limits = c(-max(abs(c(range(Mean_Gammas[, 1:2]))))
, max(abs(c(range(Mean_Gammas[, 1:2])))))) +
labs(title = "Bayes", x = expression(v[1]), y = expression(v[2])) +
theme_bw() +
theme(plot.title = element_text(hjust = 0.5))
#> Error: object 'Mean_Gammas' not found
print(BiplotBayes2)
#> Error: object 'BiplotBayes2' not found
BiplotBayes3 <-
ggplot(data = Mean_Alphas, mapping = aes(x = V1, y = V2)) +
geom_point() +
geom_hline(yintercept = 0) +
geom_vline(xintercept = 0) +
geom_text(aes(label = 1:nrow(Mean_Alphas)),
vjust = "inward", hjust = "inward") +
geom_point(data = Mean_Gammas, mapping = aes(x = V1, y = V2)) +
geom_segment(data = Mean_Gammas,
aes(x = 0, y = 0, xend = V1, yend = V2),
arrow = arrow(length = unit(0.2, "cm"))
, alpha = 0.75, color = "red") +
geom_text(data = Mean_Gammas,
aes(x = V1, y = V2,
label = paste0("E", 1:nrow(Mean_Gammas))),
vjust = "inward", hjust = "inward") +
scale_x_continuous(
limits = c(-max(abs(c(range(Mean_Alphas[, 1:2], Mean_Gammas[, 1:2]))))
, max(abs(c(range(Mean_Alphas[, 1:2], Mean_Gammas[, 1:2])))))) +
scale_y_continuous(
limits = c(-max(abs(c(range(Mean_Alphas[, 1:2], Mean_Gammas[, 1:2]))))
, max(abs(c(range(Mean_Alphas[, 1:2], Mean_Gammas[, 1:2])))))) +
labs(title = "Bayes", x = expression(PC[1]), y = expression(PC[2])) +
theme_bw() +
theme(plot.title = element_text(hjust = 0.5))
#> Error: object 'Mean_Alphas' not found
print(BiplotBayes3)
#> Error: object 'BiplotBayes3' not found
Plot1Mu <-
ggplot(data = fm3$mu1, mapping = aes(x = 1:nrow(fm3$mu1), y = mu)) +
geom_line(color = "blue") +
scale_x_continuous(labels = scales::comma) +
scale_y_continuous(labels = scales::comma) +
labs(y = expression(mu), x = "Iterations") +
theme_bw()
#> Error: object 'fm3' not found
print(Plot1Mu)
#> Error: object 'Plot1Mu' not found
Plot2Mu <-
ggplot(data = fm3$mu1, mapping = aes(mu)) +
geom_histogram() +
scale_x_continuous(labels = scales::comma) +
scale_y_continuous(labels = scales::comma) +
labs(y = "Frequency", x = expression(mu)) +
theme_bw()
#> Error: object 'fm3' not found
print(Plot2Mu)
#> Error: object 'Plot2Mu' not found
Plot1Sigma2 <-
ggplot(data = fm3$tau1, mapping = aes(x = 1:nrow(fm3$tau1), y = tau)) +
geom_line(color = "blue") +
scale_x_continuous(labels = scales::comma) +
scale_y_continuous(labels = scales::comma) +
labs(y = expression(sigma^2), x = "Iterations") +
theme_bw()
#> Error: object 'fm3' not found
print(Plot1Sigma2)
#> Error: object 'Plot1Sigma2' not found
Plot2Sigma2 <-
ggplot(data = fm3$tau1, mapping = aes(tau)) +
geom_histogram() +
scale_x_continuous(labels = scales::comma) +
scale_y_continuous(labels = scales::comma) +
labs(y = "Frequency", x = expression(sigma^2)) +
theme_bw()
#> Error: object 'fm3' not found
print(Plot2Sigma2)
#> Error: object 'Plot2Sigma2' not found
# Plot of Alphas
Plot1Alpha1 <-
ggplot(data = fm3$tao1, mapping = aes(x = 1:nrow(fm3$tao1), y = tao1)) +
geom_line(color = "blue") +
scale_x_continuous(labels = scales::comma) +
scale_y_continuous(labels = scales::comma) +
labs(y = expression(alpha[1]), x = "Iterations") +
theme_bw()
#> Error: object 'fm3' not found
print(Plot1Alpha1)
#> Error: object 'Plot1Alpha1' not found
Plot2Alpha1 <-
ggplot(data = fm3$tao1, mapping = aes(tao1)) +
geom_histogram() +
scale_x_continuous(labels = scales::comma) +
scale_y_continuous(labels = scales::comma) +
labs(y = "Frequency", x = expression(alpha[1])) +
theme_bw()
#> Error: object 'fm3' not found
print(Plot2Alpha1)
#> Error: object 'Plot2Alpha1' not found
Plot1Alpha2 <-
ggplot(data = fm3$tao1, mapping = aes(x = 1:nrow(fm3$tao1), y = tao2)) +
geom_line(color = "blue") +
scale_x_continuous(labels = scales::comma) +
scale_y_continuous(labels = scales::comma) +
labs(y = expression(alpha[2]), x = "Iterations") +
theme_bw()
#> Error: object 'fm3' not found
print(Plot1Alpha2)
#> Error: object 'Plot1Alpha2' not found
Plot2Alpha2 <-
ggplot(data = fm3$tao1, mapping = aes(tao2)) +
geom_histogram() +
scale_x_continuous(labels = scales::comma) +
scale_y_continuous(labels = scales::comma) +
labs(y = "Frequency", x = expression(alpha[2])) +
theme_bw()
#> Error: object 'fm3' not found
print(Plot2Alpha2)
#> Error: object 'Plot2Alpha2' not found
# Plot of Betas
Plot1Beta1 <-
ggplot(data = fm3$delta1, mapping = aes(x = 1:nrow(fm3$delta1), y = delta1)) +
geom_line(color = "blue") +
scale_x_continuous(labels = scales::comma) +
scale_y_continuous(labels = scales::comma) +
labs(y = expression(beta[1]), x = "Iterations") +
theme_bw()
#> Error: object 'fm3' not found
print(Plot1Beta1)
#> Error: object 'Plot1Beta1' not found
Plot2Beta1 <-
ggplot(data = fm3$delta1, mapping = aes(delta1)) +
geom_histogram() +
scale_x_continuous(labels = scales::comma) +
scale_y_continuous(labels = scales::comma) +
labs(y = "Frequency", x = expression(beta[1])) +
theme_bw()
#> Error: object 'fm3' not found
print(Plot2Beta1)
#> Error: object 'Plot2Beta1' not found
Plot1Beta2 <-
ggplot(data = fm3$delta1, mapping = aes(x = 1:nrow(fm3$delta1), y = delta2)) +
geom_line(color = "blue") +
scale_x_continuous(labels = scales::comma) +
scale_y_continuous(labels = scales::comma) +
labs(y = expression(beta[2]), x = "Iterations") +
theme_bw()
#> Error: object 'fm3' not found
print(Plot1Beta2)
#> Error: object 'Plot1Beta2' not found
Plot2Beta2 <-
ggplot(data = fm3$delta1, mapping = aes(delta2)) +
geom_histogram() +
scale_x_continuous(labels = scales::comma) +
scale_y_continuous(labels = scales::comma) +
labs(y = "Frequency", x = expression(beta[2])) +
theme_bw()
#> Error: object 'fm3' not found
print(Plot2Beta2)
#> Error: object 'Plot2Beta2' not found
Plot1Beta3 <-
ggplot(data = fm3$delta1, mapping = aes(x = 1:nrow(fm3$delta1), y = delta3)) +
geom_line(color = "blue") +
scale_x_continuous(labels = scales::comma) +
scale_y_continuous(labels = scales::comma) +
labs(y = expression(beta[3]), x = "Iterations") +
theme_bw()
#> Error: object 'fm3' not found
print(Plot1Beta3)
#> Error: object 'Plot1Beta3' not found
Plot2Beta3 <-
ggplot(data = fm3$delta1, mapping = aes(delta3)) +
geom_histogram() +
scale_x_continuous(labels = scales::comma) +
scale_y_continuous(labels = scales::comma) +
labs(y = "Frequency", x = expression(beta[3])) +
theme_bw()
#> Error: object 'fm3' not found
print(Plot2Beta3)
#> Error: object 'Plot2Beta3' not found