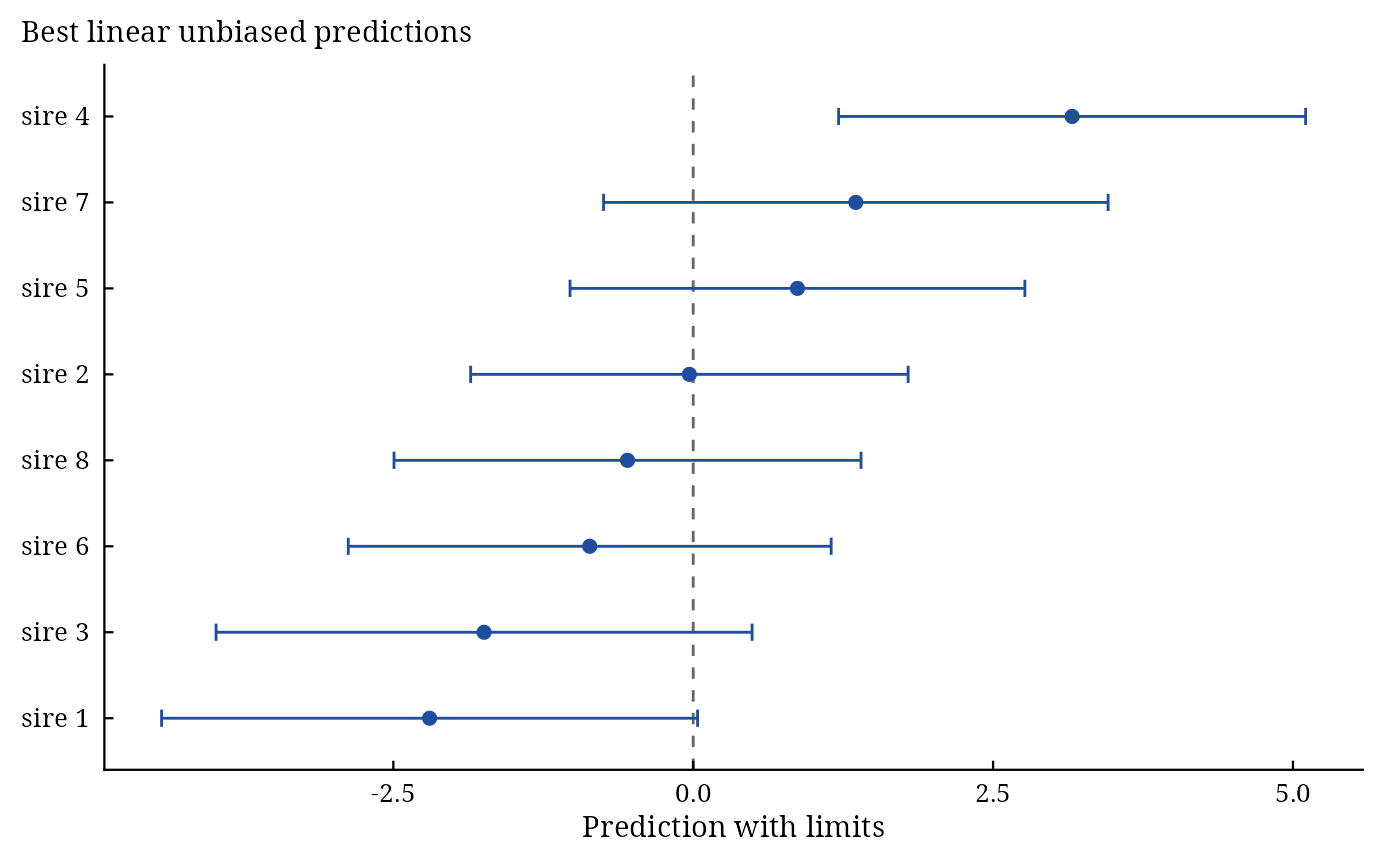
autoplot() methods for the results of VetResearchLMM; plot() draws the same
figures. A fit shows its residuals (which = "residuals", "qq" or "observed"); least-squares
means and estimates show their confidence limits; predictions of random effects are drawn as a caterpillar plot;
a comparison shows the information criteria.
Arguments
- object
a result of a function of the package.
- which
for
vlm_fit()results,"residuals"(default),"qq"or"observed".- ...
not used.
See also
Other VetResearchLMM utilities:
vlm_app(),
vlm_cite(),
vlm_interpret(),
vlm_notation(),
vlm_reference(),
vlm_save(),
vlm_theme()
Author
Muhammad Yaseen (myaseen208@gmail.com)