Example 7.2 from Generalized Linear Mixed Models: Modern Concepts, Methods and Applications by Walter W. Stroup (p-219)
Source:R/Exam7.2.R
Exam7.2.RdExam7.2 explains multifactor models with some factors qualitative and some quantitative(Equal slopes ANCOVA)
References
Stroup, W. W. (2012). Generalized Linear Mixed Models: Modern Concepts, Methods and Applications. CRC Press.
@seealso
DataSet7.2
Author
Muhammad Yaseen (myaseen208@gmail.com)
Adeela Munawar (adeela.uaf@gmail.com)
Examples
library(emmeans)
library(car)
library(ggplot2)

data(DataSet7.2)
DataSet7.2$trt <- factor( x = DataSet7.2$trt )

##----ANCOVA(Equal slope Model)
Exam7.2fm1 <- aov(formula = y ~ trt*x, data = DataSet7.2)
car::Anova(mod = Exam7.2fm1 , type = "III")
#> Anova Table (Type III tests)
#>
#> Response: y
#>              Sum Sq Df  F value    Pr(>F)
#> (Intercept) 1225.64  1 199.1846 7.785e-09 ***
#> trt           55.55  3   3.0091   0.07225 .
#> x            209.27  1  34.0093 8.064e-05 ***
#> trt:x         25.96  3   1.4062   0.28893
#> Residuals     73.84 12
#> ---
#> Signif. codes:  0 ‘***’ 0.001 ‘**’ 0.01 ‘*’ 0.05 ‘.’ 0.1 ‘ ’ 1

##---ANCOVA(without interaction because of non significant slope effect)
Exam7.2fm2 <- aov(formula = y ~ trt + x, data    = DataSet7.2)
car::Anova(mod = Exam7.2fm2 , type = "III")
#> Anova Table (Type III tests)
#>
#> Response: y
#>              Sum Sq Df F value    Pr(>F)
#> (Intercept) 2994.45  1 450.076 1.340e-12 ***
#> trt          302.16  3  15.138 8.301e-05 ***
#> x            542.90  1  81.599 1.871e-07 ***
#> Residuals     99.80 15
#> ---
#> Signif. codes:  0 ‘***’ 0.001 ‘**’ 0.01 ‘*’ 0.05 ‘.’ 0.1 ‘ ’ 1

##---Ls means for 2nd model
emmeans(object  = Exam7.2fm2, specs = ~trt)
#>  trt emmean   SE df lower.CL upper.CL
#>  1     47.7 1.17 15     45.2     50.2
#>  2     54.6 1.19 15     52.1     57.1
#>  3     44.9 1.23 15     42.3     47.5
#>  4     53.1 1.26 15     50.4     55.8
#>
#> Confidence level used: 0.95

##---Anova without covariate
Exam7.2fm3 <- aov(formula = y ~ trt, data = DataSet7.2)
car::Anova(mod = Exam7.2fm3, type = "III")
#> Anova Table (Type III tests)
#>
#> Response: y
#>              Sum Sq Df  F value    Pr(>F)
#> (Intercept) 10448.2  1 260.1115 2.564e-11 ***
#> trt           385.3  3   3.1972   0.05183 .
#> Residuals     642.7 16
#> ---
#> Signif. codes:  0 ‘***’ 0.001 ‘**’ 0.01 ‘*’ 0.05 ‘.’ 0.1 ‘ ’ 1

##---Ls means for 3rd model
emmeans(object = Exam7.2fm3, specs = ~trt)
#>  trt emmean   SE df lower.CL upper.CL
#>  1     45.7 2.83 16     39.7     51.7
#>  2     57.4 2.83 16     51.4     63.4
#>  3     48.7 2.83 16     42.7     54.8
#>  4     48.4 2.83 16     42.4     54.5
#>
#> Confidence level used: 0.95

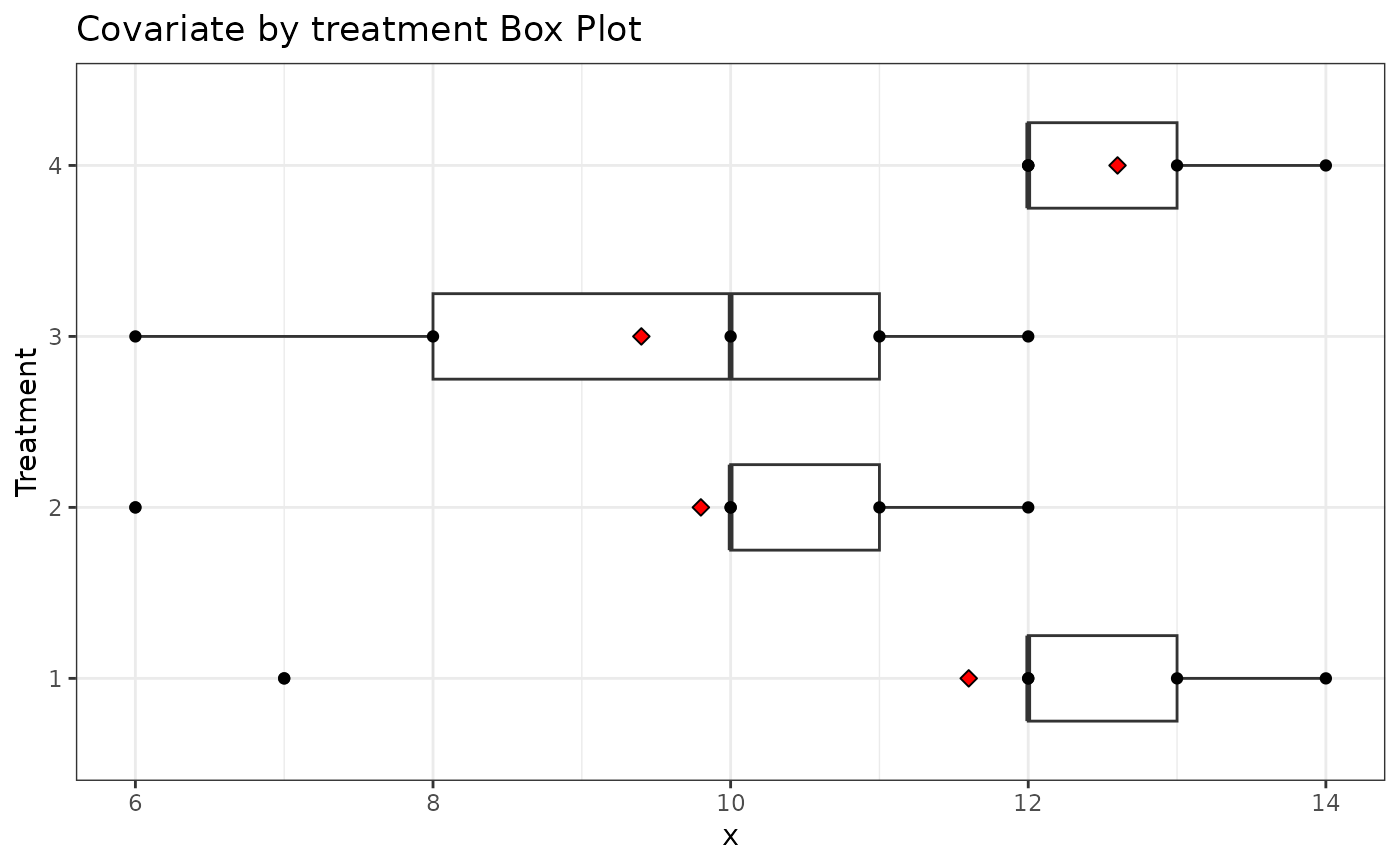
##---Box Plot of Covariate by treatment
Plot <-
   ggplot(
          data    = DataSet7.2
        , mapping = aes(x = factor(trt), y = x)
         )                 +
   geom_boxplot(width = 0.5) +
   coord_flip()            +
   geom_point()            +
   stat_summary(
         fun    = "mean"
       , geom     = "point"
       , shape    =  23
       , size     =  2
       , fill     = "red"
       )                   +
   theme_bw()              +
   ggtitle("Covariate by treatment Box Plot") +
   xlab("Treatment")
print(Plot)
