Example1.2 from Generalized Linear Mixed Models: Modern Concepts, Methods and Applications by Walter W. Stroup(p-9)
Source:R/Exam1.2.R
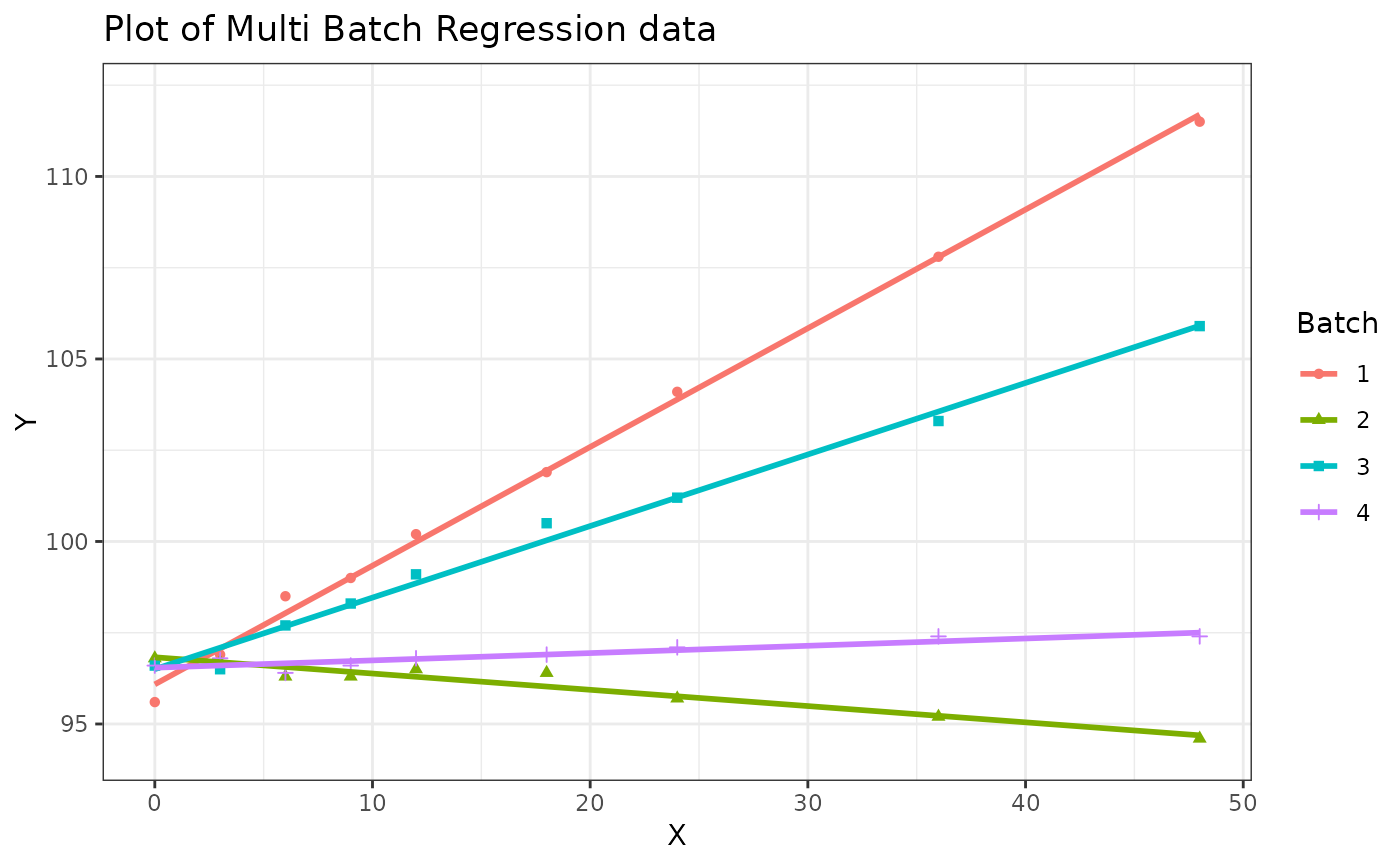
Exam1.2.RdExam1.2 is used to see types of model effects by plotting regression data
References
Stroup, W. W. (2012). Generalized Linear Mixed Models: Modern Concepts, Methods and Applications. CRC Press.
Author
Muhammad Yaseen (myaseen208@gmail.com)
Adeela Munawar (adeela.uaf@gmail.com)
Examples
#-------------------------------------------------------------
## Plot of multi-batch regression data discussed in Article 1.3
#-------------------------------------------------------------
data(Table1.1)

Table1.2$Batch <- factor(x  = Table1.2$Batch)

library(ggplot2)
Plot  <-
 ggplot(data = Table1.2, mapping = aes(y = Y, x = X, colour = Batch, shape = Batch))      +
 geom_point() +
 geom_smooth(method = "lm", fill =  NA) +
 labs(title   = "Plot of Multi Batch Regression data") +
 theme_bw()
Plot
#> `geom_smooth()` using formula = 'y ~ x'